
Fig. 5
- ID
- ZDB-IMAGE-190809-12
- Genes
- Publication
- Lin et al., 2019 - Identification of Novel Anti-Liver Cancer Small Molecules with Better Therapeutic Index than Sorafenib via Zebrafish Drug Screening Platform
- All Figures
- Figures for Lin et al., 2019
|
Fig. 5
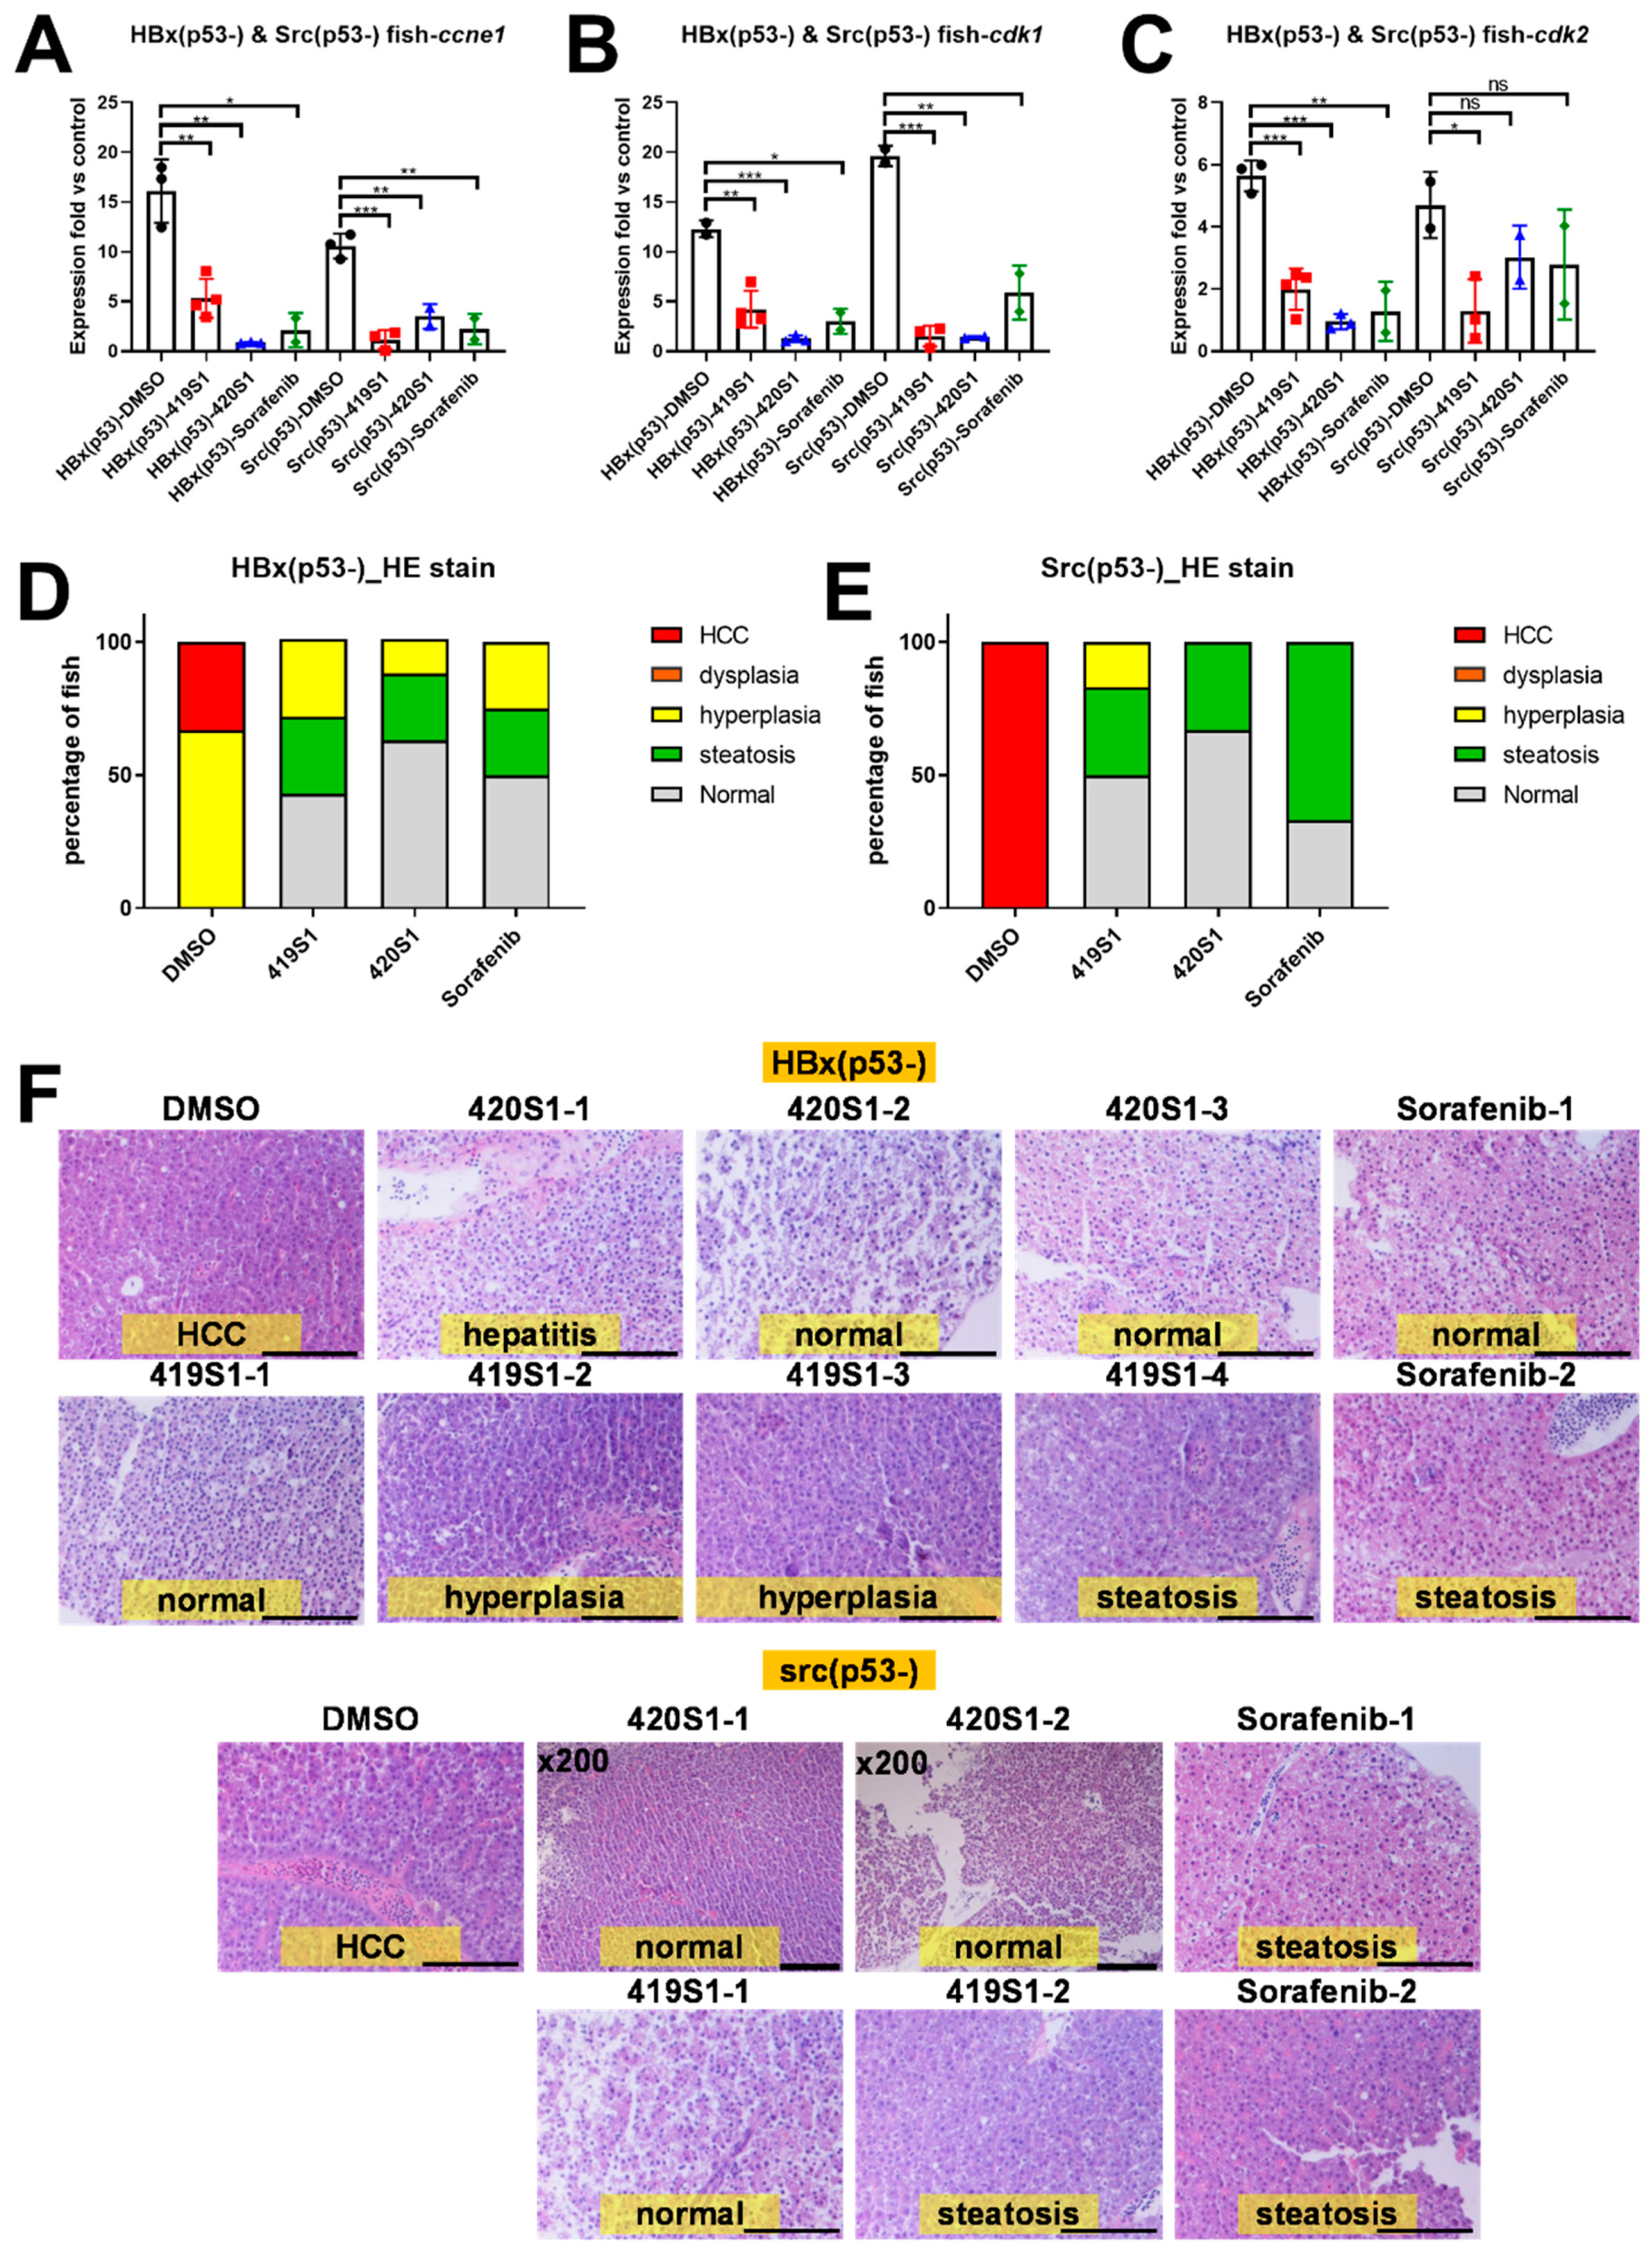
Treatment with 419S1 and 420S1 blocked hepatocellular carcinoma (HCC) formation in Tg(fabp10a:HBx, p53−) and Tg(fabp10a:src, p53−) transgenic zebrafish. (A–C) Dot-plot of the relative expression fold of cell-cycle-related genes ccne1, cdk1, and cdk2 after drug treatment compared to control fish. DMSO-treated Tg(fabp10a:HBx, p53−) and Tg(fabp10a:src, p53−) transgenic fish exhibited high levels of ccne1, cdk1, and cdk2 expression compared to control fish. DMSO- (black circle), 419S1- (red square), 420S1- (blue triangle), and Sorafenib (green diamond)-treated Tg(fabp10a:HBx, p53−) and Tg(fabp10a:src, p53−) transgenic fish demonstrated significantly decreased ccne1 expression compared to DMSO. (D,E) Percentage of fish with various histopathological features revealed by hematoxylin and eosin (H&E) staining after different drug treatments for one month. Red indicates HCC, orange denotes dysplasia, yellow represents hyperplasia, green denotes steatosis, and grey is normal hepatocyte. (F) Representative images of H&E stain (400 ×) after one month of 419S1, 420S1, or Sorafenib treatment. Top panels are Tg(fabp10a:HBx, p53−) and bottom panels are Tg(fabp10a:src, p53−) transgenic fish. Scare bar: 100 μm. *: 0.01 < p ≤ 0.05; **: 0.001 < p ≤ 0.01; ***: p ≤ 0.001.