
|
Fig. S2
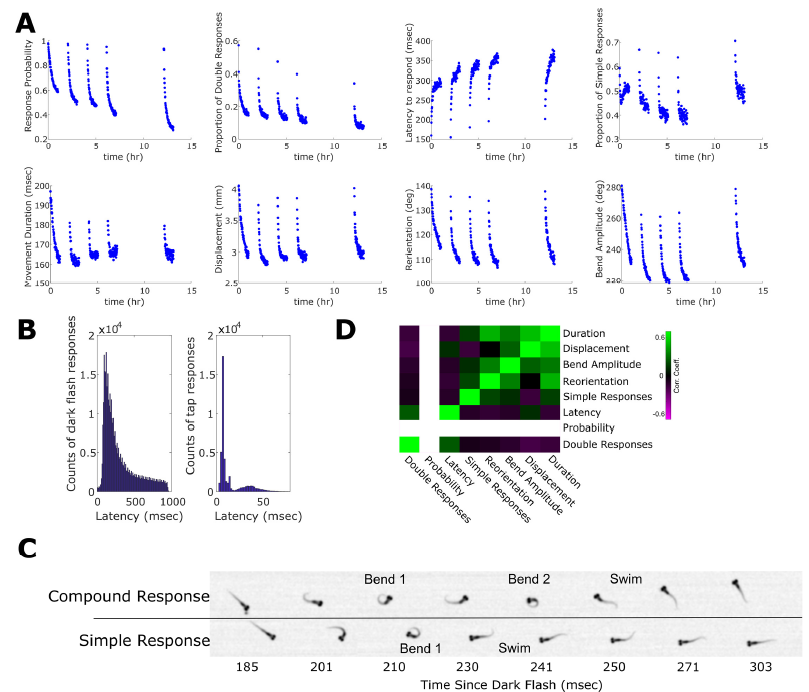
Habituation of dark flash response components. Related to Figures 2 and 3.
A) Habituation is evident in 8 different components of the response, each dot represents the mean response to
each stimulus (n=3120 larvae).
B) Histograms of the distribution of latencies observed in response to dark flashes. n = 392161 responses in
3120 larvae (left). Histograms of the bimodal distribution of latencies observed in response to taps. n = 44515
responses in 3120 larvae (right).
C) A “Compound Response” is defined as a movement where a large angle bend (Bend 1) is followed by a
period of partial relaxation of the bend, before performing a second large angle bend (Bend 2). Finally, the
larva fully relaxes and swims forward. In contrast, a “Simple Response” is characterized by a single large angle
bend (Bend 1), which fully relaxes and the larva swims forward.
C) Correlation matrix quantifying how correlated individual components of the dark flash response are in naïve
larvae (Spearman’s Rho). The matrix is sorted as to match Figure 3D. Note that the “Probability” component
can not be compared with the other components, since the remaining components can only be analyzed in
conditions when a larva responds to the flash