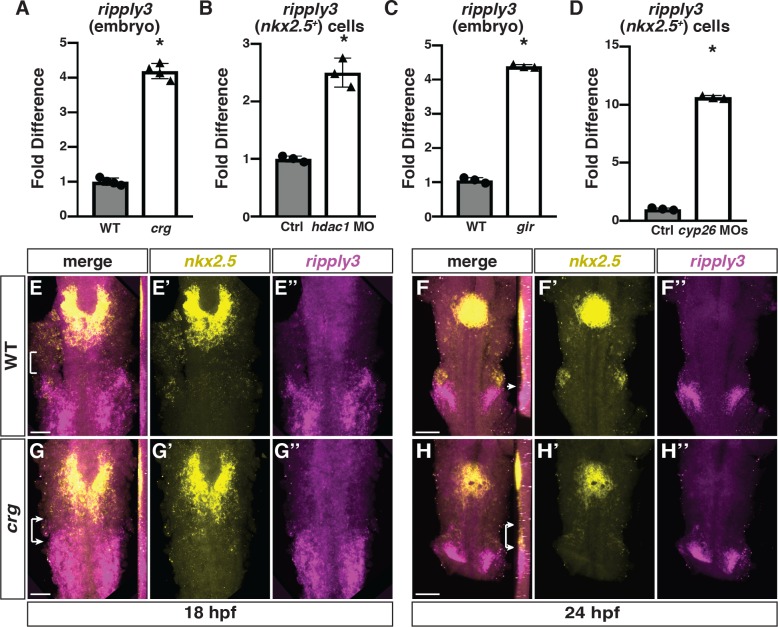
IMAGE

Fig 7

ID
ZDB-IMAGE-190723-838
Genes
Source
Figures for Song et al., 2019
Image
Figure Caption

Fig 7 <italic>Ripply3</italic> is expanded anteriorly into <italic>nkx2</italic>.<italic>5+</italic> cells in <italic>crg</italic> mutants.

(A-D) RT-qPCR for ripply3 expression in whole embryos at 48 hpf and sorted nkx2.5:ZsYellow+ cells at 28 hpf. (E-H”) Confocal images of two-color FISH for nkx2.5 and ripply3 in WT and crg mutant embryos at 18 and 24 hpf. Images are dorsal views with anterior up. Insets in F-H indicate lateral views of the confocal images. Bracket in E indicates space between posterior nkx2.5 and anterior ripply3 domains. Arrow in F indicates border between nkx2.5 in pharyngeal mesoderm and ripply3 in pharyngeal endoderm. Brackets with arrows in G and H indicate overlap in nkx2.5 and ripply3 domains in crg mutant embryos. n = 22 WT and n = 5 crg mutants embryos for 18 hpf and n = 19 WT and n = 11 crg mutants embryos for 24 hpf examined. Scale bars in E and G are 50 μm. Scale bars in F and H are 100 μm.

Figure Data
Acknowledgments
This image is the copyrighted work of the attributed author or publisher, and ZFIN has permission only to display this image to its users. Additional permissions should be obtained from the applicable author or publisher of the image. Full text @ PLoS Genet.