
FIGURE 6
- ID
- ZDB-IMAGE-190723-807
- Genes
- Antibodies
- Publication
- Li et al., 2019 - Tubgcp3 Is Required for Retinal Progenitor Cell Proliferation During Zebrafish Development
- All Figures
- Figures for Li et al., 2019
|
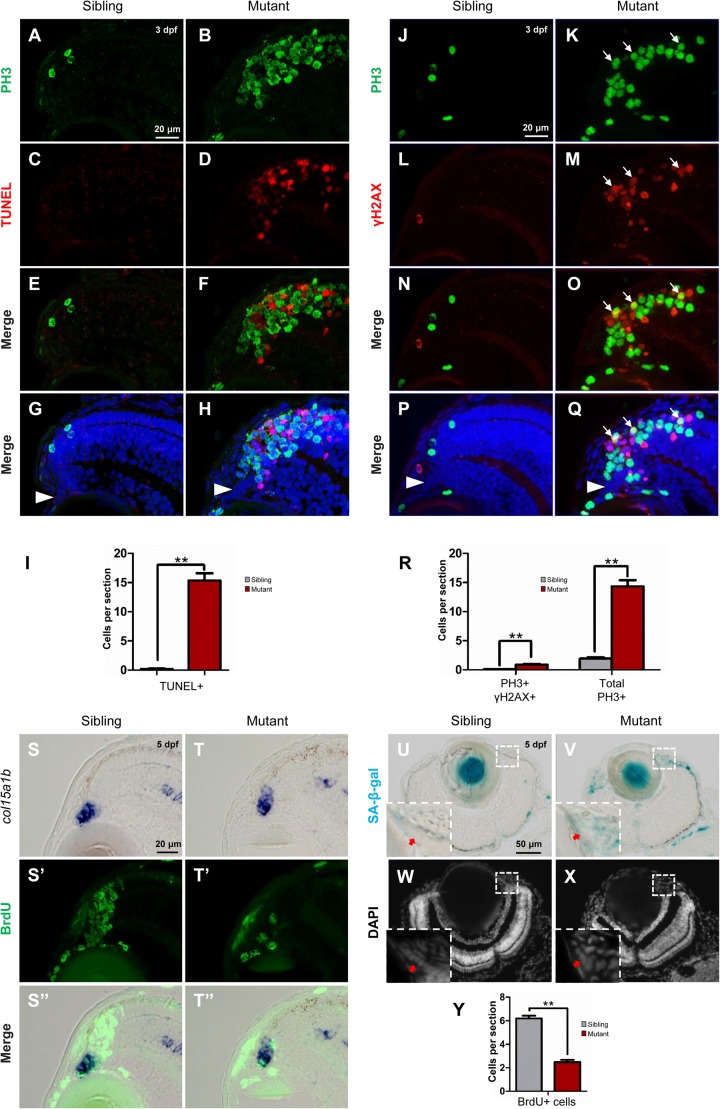
FIGURE 6
Tupgcp3 deficient cells undergo apoptosis and senescence. (A–H) Immunostaining analyses displaying significantly increased TUNEL+ cells in the tubgcp3 mutant retina (D,F,H)at 3 dpf compared to wild-type sibling (C,E,G). Note the increased PH3+ cells in the tubgcp3mutant retina do not co-localize with the TUNEL+ cells (F,H). (I) Bar chart analyses depicting quantification of TUNEL+ cells in wild-type sibling and the tubgcp3 mutant retinae. (J–Q)Immunostaining analyses exhibiting markedly increased γ-H2AX+ cells in the tubgcp3 mutant retina (M,O,Q) at 3 dpf compared to wild-type sibling (L,N,P). Note that some of the (increased PH3+ cells overlap with the γ-H2AX+ cells in the tubgcp3 mutant (O,Q). Arrows mark the PH3 and γ-H2AX double positive cells in the tubgcp3 mutant retina. Arrowheads indicate the location of RSCs in the CMZ of the retina. (R) Bar chart analyses depicting quantification of γ-H2AX+ and PH3+ cells in wild-type sibling and the tubgcp3 mutant retinae. Data are mean + SEM from 30 sections for each group. Student’s t-test: ∗∗P < 0.01. (S–T”) ISH and immunostaining analysis of cell proliferation at the extreme periphery of CMZ at 5 dpf. Zebrafish embryos were incubated in BrdU for 24 h before collected at 5 dpf for the double staining assay. In the wild-type sibling, there are many BrdU+ cells in col15a1b-labeled region (S,S’,S”). In contrast, BrdU+ cells are significantly decreased in this region in the tubgcp3 mutant CMZ (T,T’,T”). (U–X)Senescence-associated β-galactosidase (SA-β-gal) staining exhibiting increased β-galactosidase activity at the CMZ in the tubgcp3 mutant (V) compared to the wild-type sibling (U). Nuclei are stained with DAPI (W,X). Insets indicate high-magnification images of the peripheral edge of CMZ in rectangles in (U–X). (Y) Bar chart analyses depicting quantification of BrdU+ cells in the col15a1b-labeled region in wild-type sibling and the tubgcp3 mutant CMZ. Data are mean + SEM from 36 sections for each group. Student’s t-test: ∗∗P < 0.01. Scale bars: 20 μm (A–H); 20 μm (J–Q); 20 μm (S–T”); 50 μm (U–X).