IMAGE

Fig. 2

ID
ZDB-IMAGE-190723-759
Source
Figures for Kimura et al., 2019
Image
Figure Caption

Fig. 2

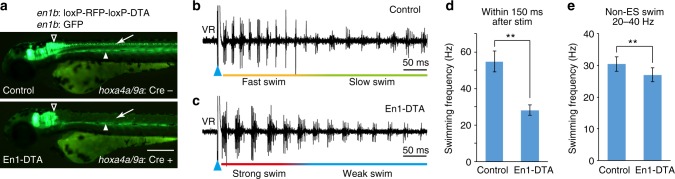
V1 ablation reduced cycle frequency in swimming. a Fluorescent images (green channel) of Tg[en1b:GFP] and Tg[en1b:loxP-RFP-loxP-DTA] fish with (bottom panel) or without (top panel) Tg[hoxa4a/9a:Cre]. Green fluorescent protein (GFP) expression in the spinal V1 neurons (arrow) is absent in the presence of Cre (En1-DTA), with GFP expression in the brain (triangle) and slow muscle cells in the middle region of the body (arrowhead) being intact. Scale bar, 250 μm. b, c Ventral root recordings of fictive swimming elicited by electrical stimulations (ESs) in a control (b) and an En1-DTA fish (c). d Swimming frequency of control and En1-DTA fish during the initial phase of ES swim (swimming elicited by electrical stimulation). Control: 54.8 ± 5.7 Hz, number of fish = 73. En1-DTA: 28.0 ± 2.9 Hz, n = 57. **P < 0.01 (two-tailed t test, P = 6.4 × 10−62). e Swimming frequency of control and En1-DTA fish during Non-ES swim. Swim cycles with frequencies within 20–40 Hz were picked up and averaged. Control: 30.5 ± 2.3 Hz, n = 73. En1-DTA: 27.1 ± 2.2 Hz, n = 57. **P < 0.01 (two-tailed t test, P = 2.6 × 10−14). Data are mean ± s.d.

Acknowledgments
This image is the copyrighted work of the attributed author or publisher, and ZFIN has permission only to display this image to its users. Additional permissions should be obtained from the applicable author or publisher of the image. Full text @ Nat. Commun.