IMAGE

Fig 1

ID
ZDB-IMAGE-190723-1989
Genes
Source
Figures for Progatzky et al., 2019
Image
Figure Caption

Fig 1

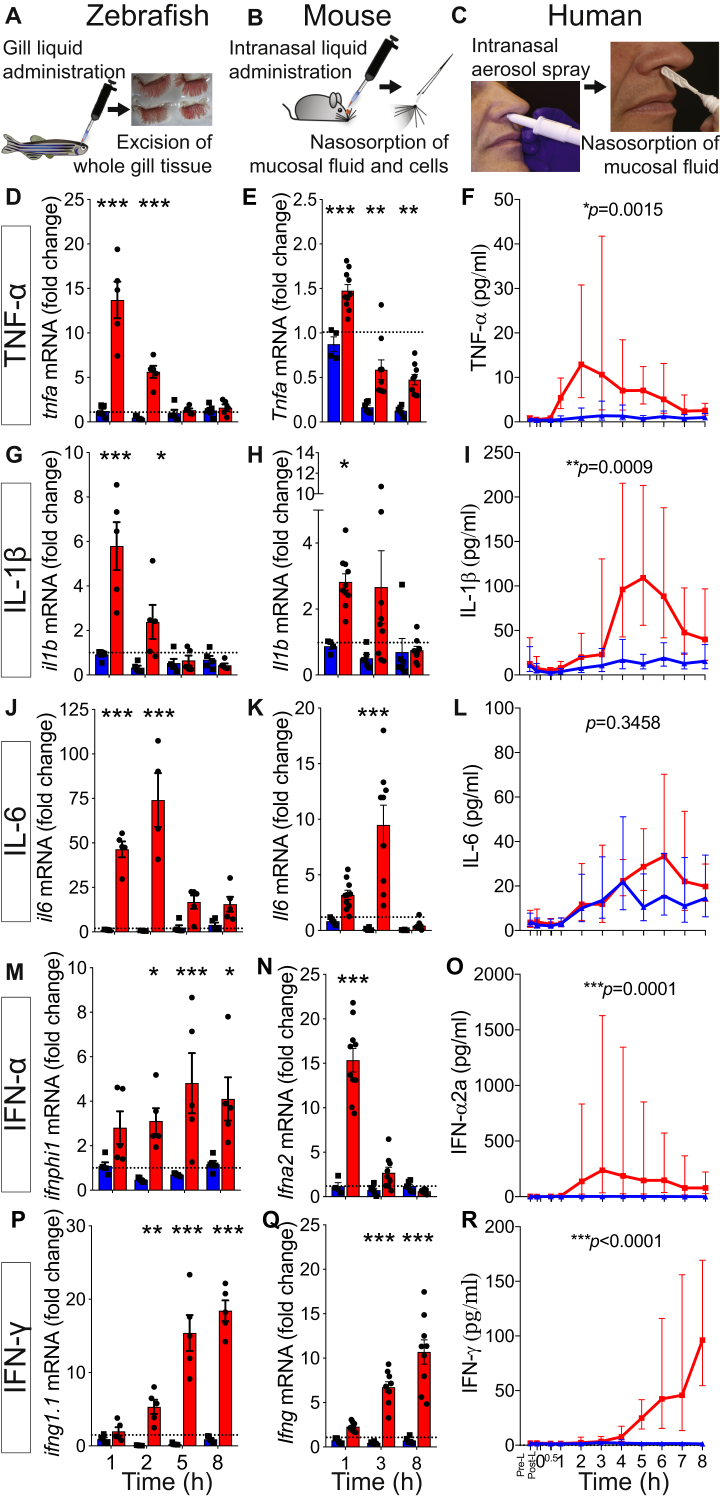
Kinetic profile of mucosal proinflammatory cytokine responses after zebrafish gill, mouse, and human nasal stimulation with R848. A-C, Schematics showing mucosal administration of TLR agonists and sampling of mucosal tissue/fluids to assess responses. D, G, J, M, and P, qRT-PCR analysis of zebrafish gills (n = 5, representative of 3 experiments). Values are presented as means ± SEMs. Two-way ANOVA followed by the Sidak multiple comparison test was used. E, H, K, N, and Q, qRT-PCR analysis of mouse nasal mucosa (n = 4-10 pooled from 2 independent experiments). Values are presented as means ± SEMs. Two-way ANOVA followed by the Sidak multiple comparison test was used. F, I, L, O, and R, Soluble protein mediator analysis of human nasal samples (n = 9). Values are presented as geometric means and 95% CIs. Paired t tests on log10-transformed area under the curve values were used. *P < .05, **P < .01, and ***P < .001.

Figure Data
Acknowledgments
This image is the copyrighted work of the attributed author or publisher, and ZFIN has permission only to display this image to its users. Additional permissions should be obtained from the applicable author or publisher of the image. Full text @ J. Allergy Clin. Immunol.