IMAGE

Figure 5

ID
ZDB-IMAGE-190723-1321
Source
Figures for Araya et al., 2019
Image
Figure Caption

Figure 5

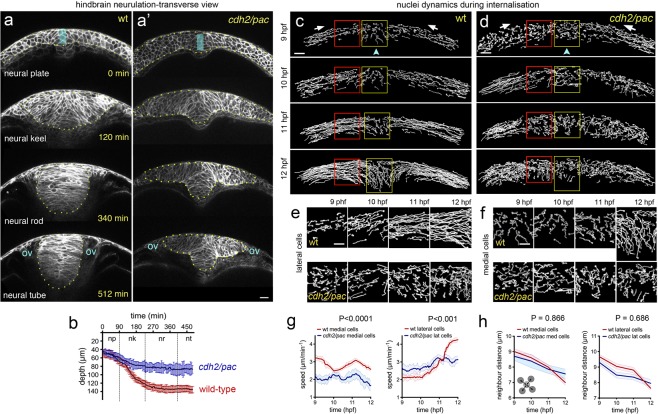
Defective cell and tissue internalisation in cdh2/pac mutants. (a-a’) Transverse confocal time-lapse images of tissue internalisation between wild-type (a) and cdh2/pac mutant (a’) embryos at hindbrain level. Cell membranes labelled with CAAX-GFP. ov, otic vesicle. Yellow dots outline neural tissue. (b) Comparative internalisation dynamics between wild-type (red) and cdh2/pac (blue) embryos as measured by depth of the neural primordium at its midline (cyan bar in a,a’). While in wild-type embryos, internalisation is responsible to deepens up to 70% of the neural primordium (~42 µm/~138 µm on average), cdh2/pac mutants average only 62% to wt values (~44 µm/~85 µm, nembryos = 4 cdh2/pac. Average depth; 85 µm cdh2/pac vs 138 µm wt). (c and d) Representative transverse images of nuclei tracks in wild-type (c) and cdh2/pac (d) neural plate cells during convergence and internalisation stages. Cdh2/pac nuclei show defective convergence and internalisation. (e) Higher magnification of lateral nuclei tracks taken from red boxes in (c,d). (f) Higher magnification of medial nuclei tracks taken from yellow boxes in (c,d). (g,h) Quantification of nuclei speeds and density between wild-type and cdh2/pac (nembryos = 3, naverage of medial cells analysed = 90, naverage of lateral cells analysed = 80, 5 z-slices analysed in each embryo). Scale bar in (a-f), 20 µm. Bars indicate SEM.

Figure Data
Acknowledgments
This image is the copyrighted work of the attributed author or publisher, and ZFIN has permission only to display this image to its users. Additional permissions should be obtained from the applicable author or publisher of the image. Full text @ Sci. Rep.