IMAGE

Figure 4

ID
ZDB-IMAGE-190723-1320
Genes
Source
Figures for Araya et al., 2019
Image
Figure Caption

Figure 4

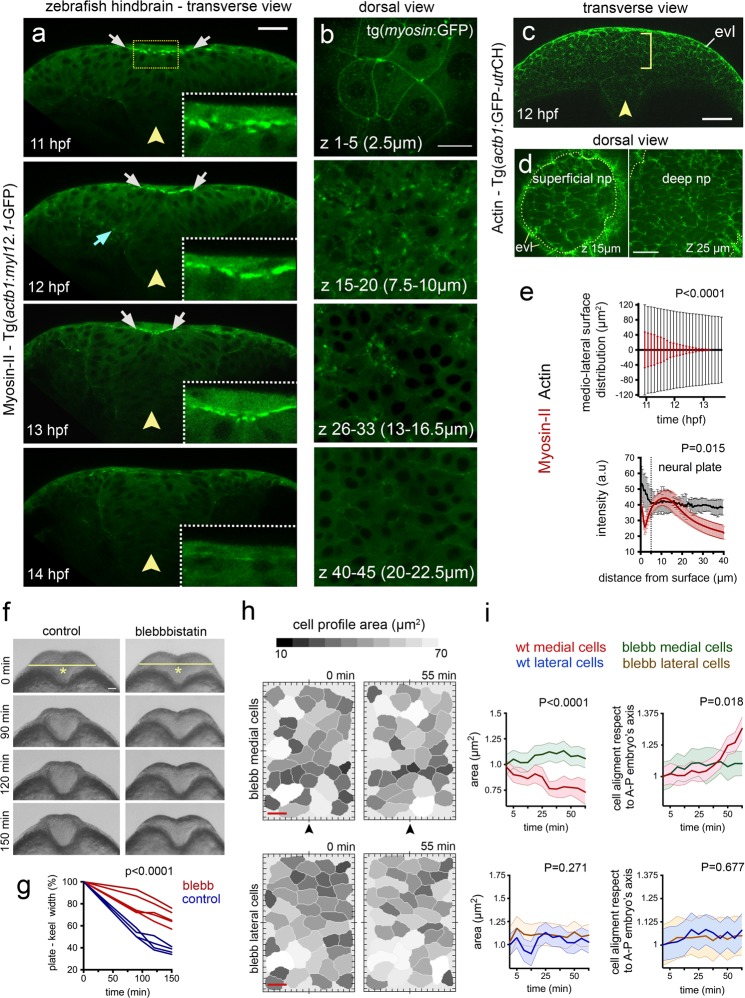
Myosin distribution and function during convergence and internalisation. (a)Transverse confocal images depicting the distribution of the Myosin-II:GFP fusion protein using Tg(actb1:myl12.1-GFP)24 transgenic line during zebrafish neural plate internalisation. White arrows in (a) indicate medial accumulation of Myosin-II:GFP, while cyan arrow shows basal accumulation. Insets show dorsal medial zone at higher magnification. Yellow arrowheads indicate midline position. Scale bar is 20 µm. (b) Dorsal view confocal images of Myosin-II:GFP expression at different depths. Top image is in EVL (the superficial non-neural epithelium), then successive depths through the neural plate. Each image is a maximum intensity projection of 5 confocal slices. Scale bar, 10 µm. (c) Representative transverse view confocal images showing actin expression by using zebrafish Tg(actb1:GFP-utrCH)25 reporter line during early internalisation. Arrowhead shows midline and brackets indicate superficial-deep axis for quantification in (e, bottom graph). Scale bar, 30 µm and arrowhead indicates midline. (d) Dorsal view confocal images of Actin:GFP distribution at dorsal surface of neural plate and 10 µm deeper. Scale bar is 20 µm. (e) Top graph: quantification of medio-lateral surface distribution of Myosin-II:GFP (red) versus Actin:GFP (black) throughout internalisation. Bottom graph: quantification of Myosin-II:GFP (red) and Actin:GFP (black) pixel intensity distribution along the superficial (EVL first 5 µm) to deeper (ventral) axis of the neural plate (see methods for quantification procedure). A.U, indicates arbitrary units. (f) Transverse views of neural morphogenesis in control and Blebbistatin treated embryos. Scale bar is 20 µm. (g) Quantification of neural plate to keel transition in control and Blebbistatin treated embryos. (h) Dorsal cell surface profiles in medial and lateral zones of neural plate in control and Blebbistatin treated embryos. Scale bar, 10 µm and time is in minutes. Arrowheads indicate position of the tissue midline. (i) Quantification of dorsal cell surface profiles and alignment of dorsal surface areas to embryonic axis in control and Blebbistatin treated embryos (nembryos = 3, nmedial cells = 35, nlateral cells = 40). In all graphs, bars indicate SEM.

Figure Data
Acknowledgments
This image is the copyrighted work of the attributed author or publisher, and ZFIN has permission only to display this image to its users. Additional permissions should be obtained from the applicable author or publisher of the image. Full text @ Sci. Rep.