
|
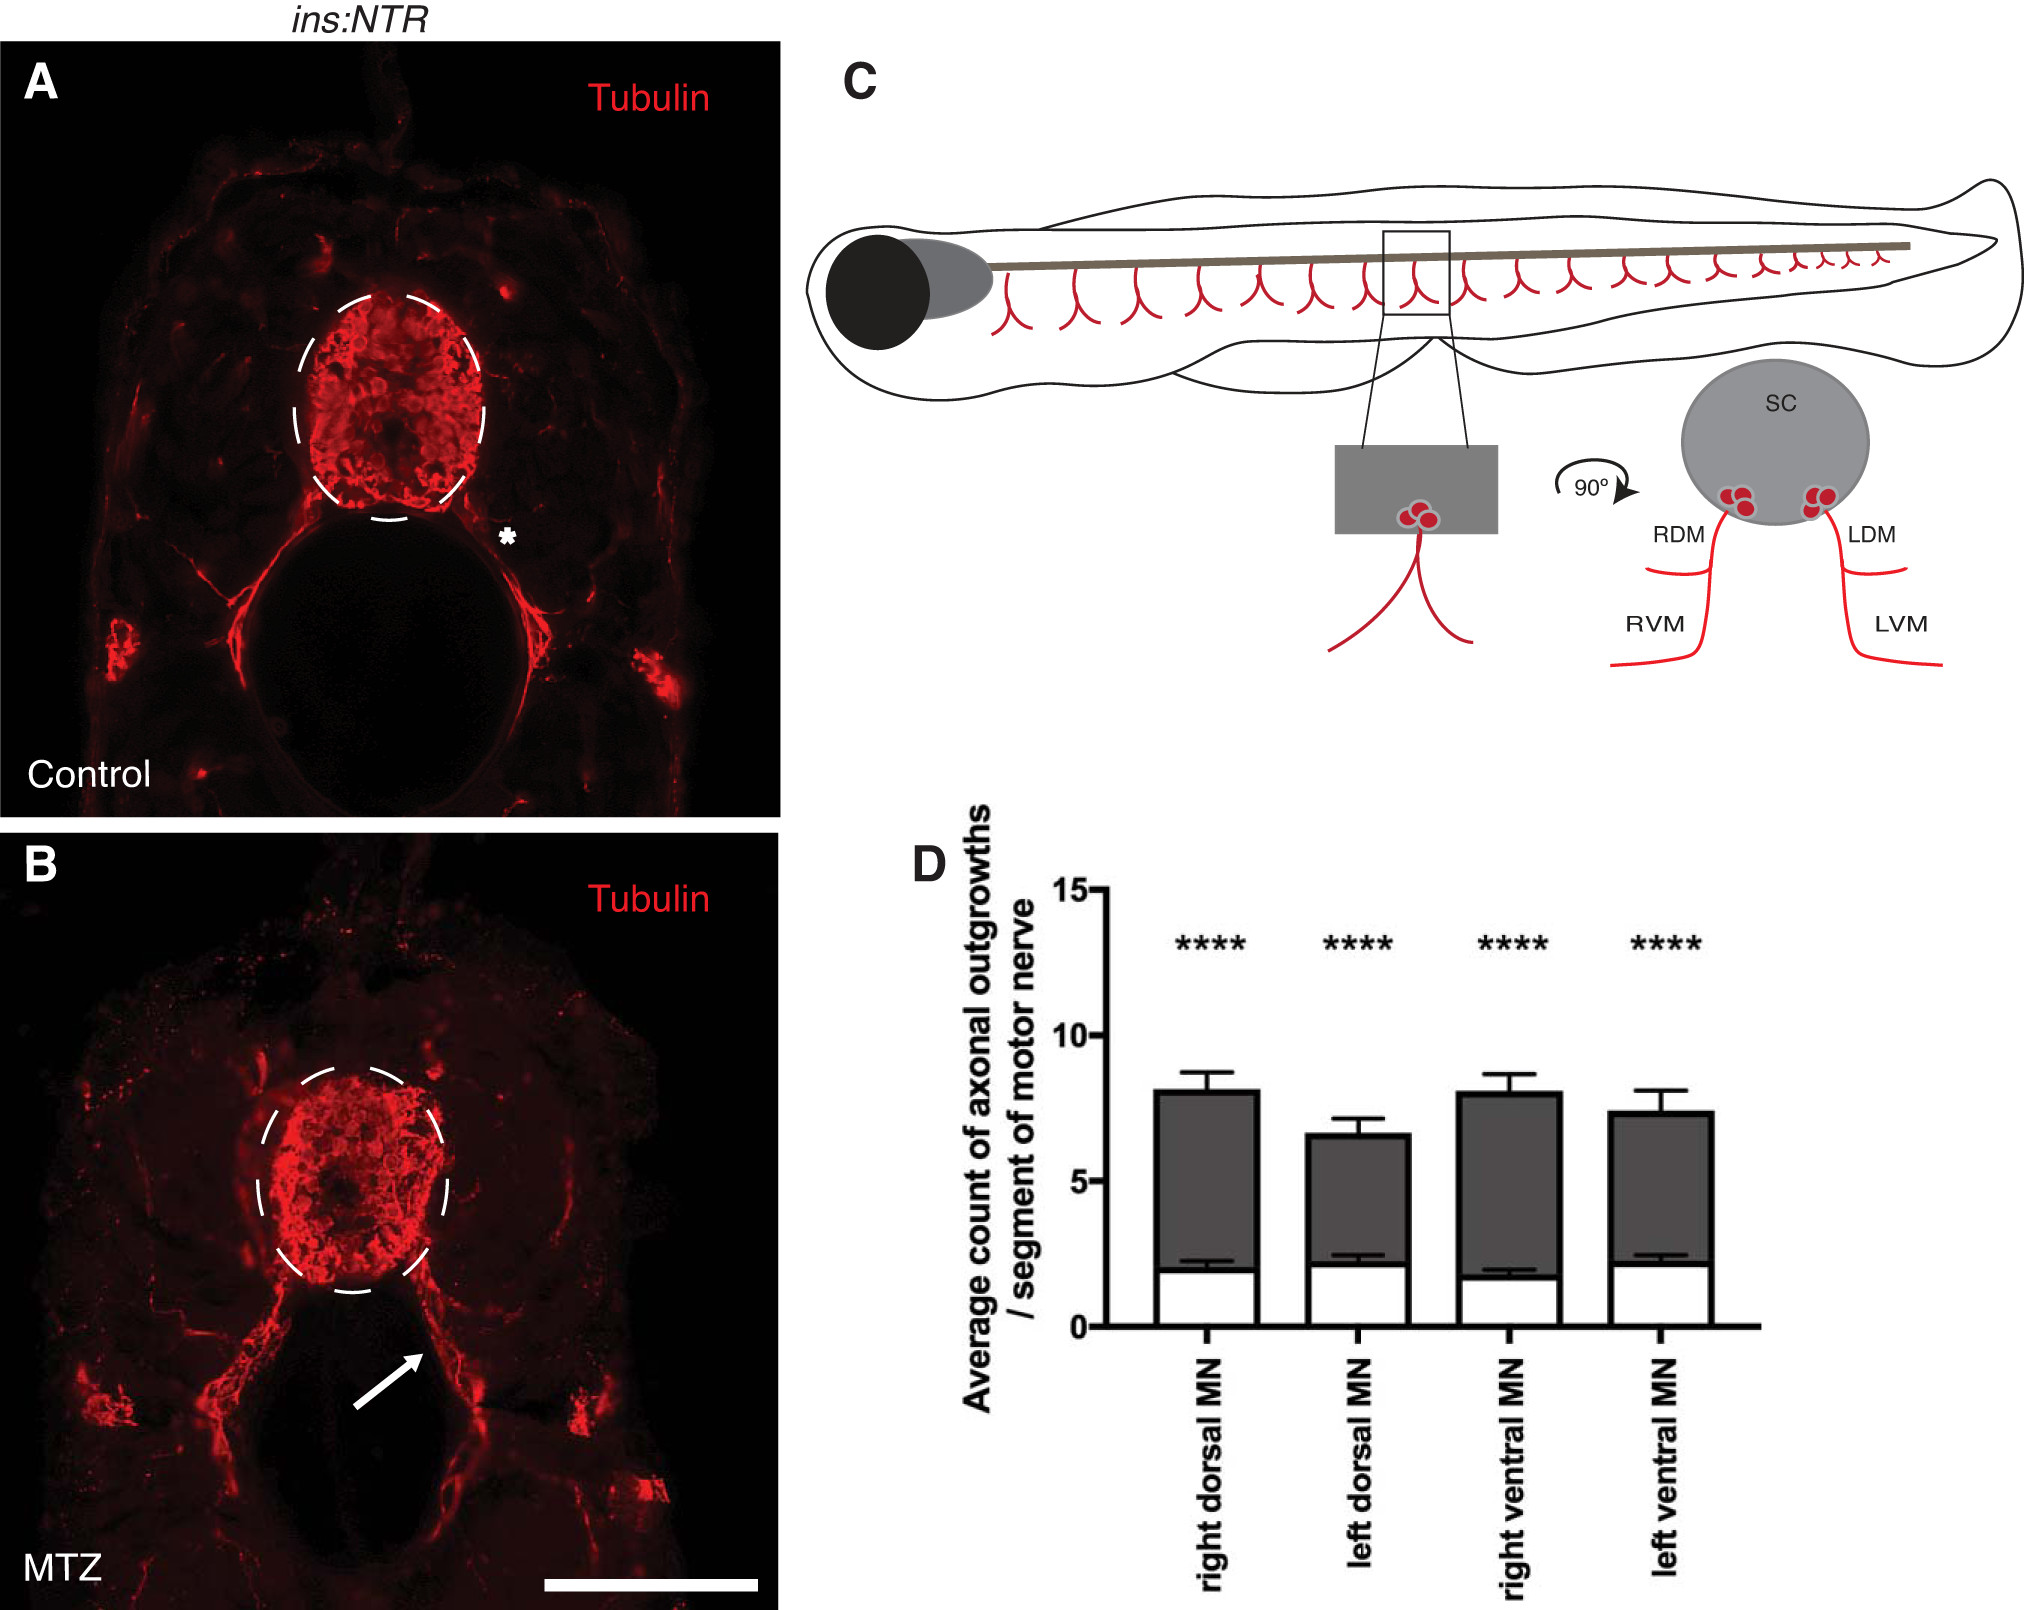
Fig. 5
Peripheral motor axons appear defasciculated in hyperglycemic larvae. A and B: following the schedule of treatment described in Fig. 1A, axons (red, acetylated α-tubulin) appear defasciculated in the ins:NTR metronidazole (MTZ)-treated group (B, arrow) compared with the ins:NTR control group (A, asterisk). Dashed lines outline the spinal cord. NTR, nitroreductase. Scale bar = 50 μm. C: schematic of the areas in which axonal outgrowths were quantified: left dorsal muscle (LDM), right dorsal muscle (RDM), left ventral muscle (LVM), right ventral muscle (RVM), and spinal cord (sc). D: no differences were observed between segments within the groups. Number of axonal outgrowths was significantly greater in MTZ-treated (gray bars) than control (white bars) segments. MN, motor nerve. ****P < 0.0001.