
|
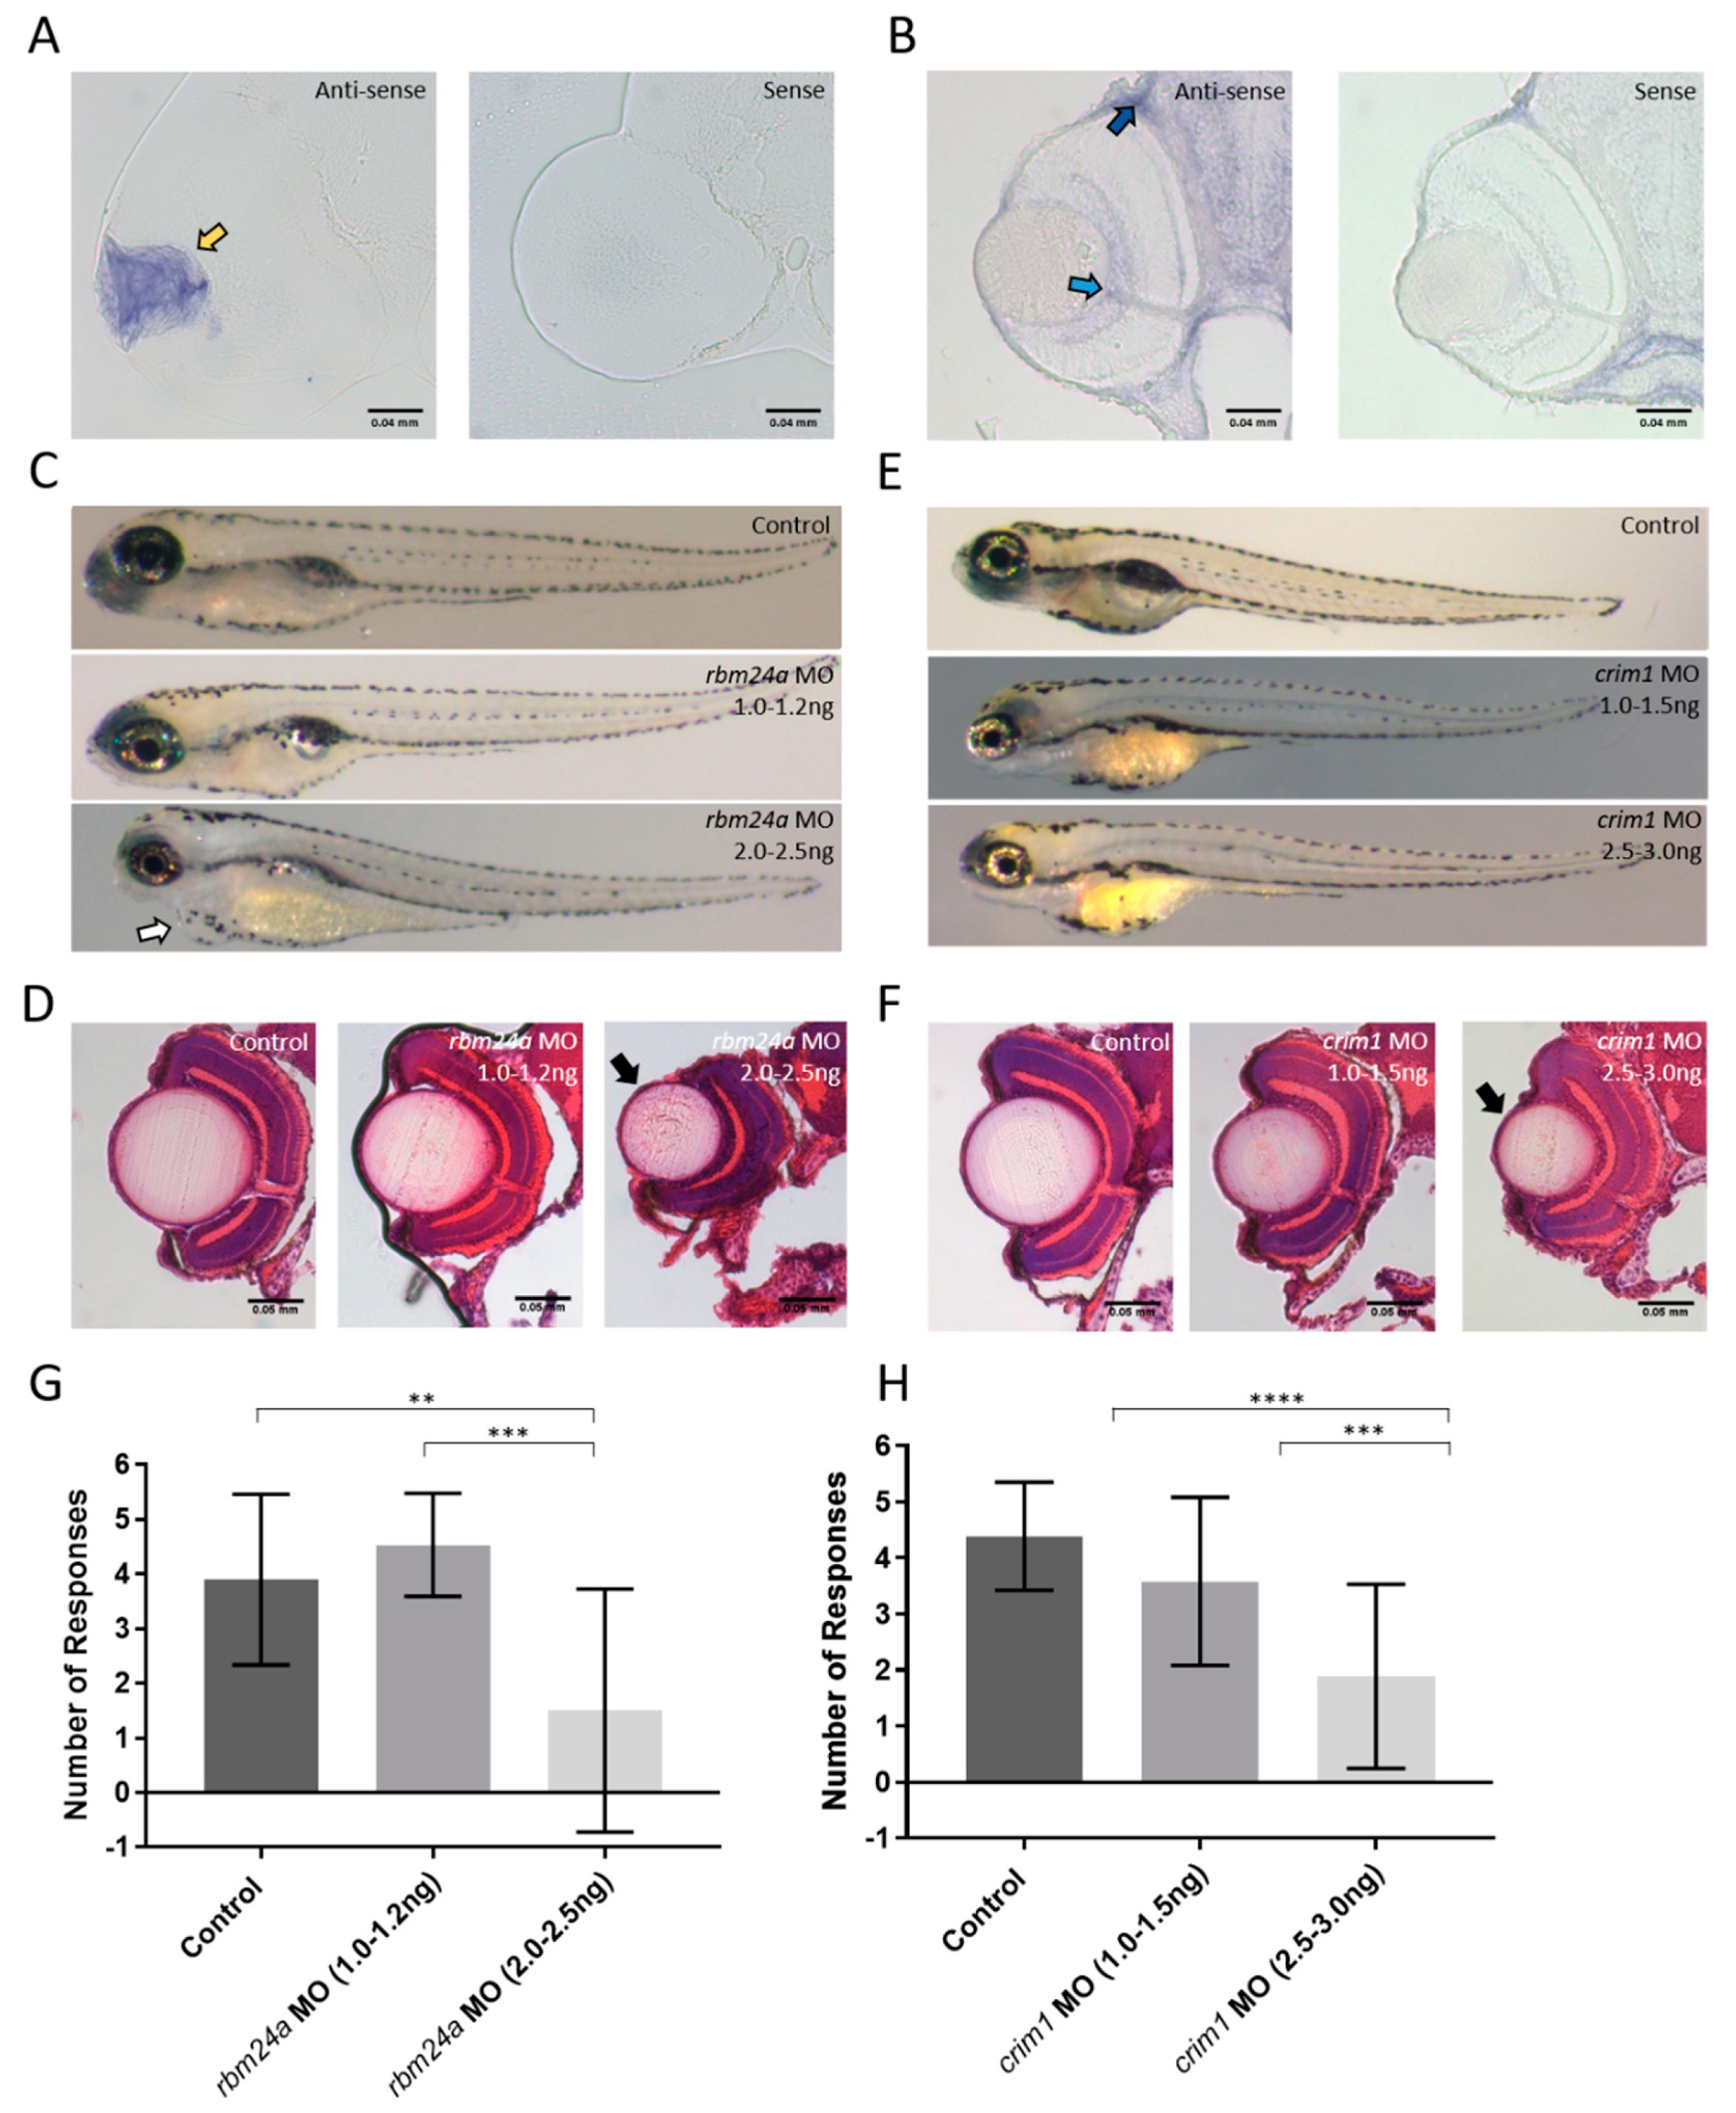
Fig. 4
Analysis of candidate genes. Whole mount in situ hybridization on 3 dpf retinal sections for (A) rbm24a; (B) and crim1; (C) Phenotypes of control, rbm24a AUG MO at 1.0–1.2 ng, and rbm24a AUG MO at 2.0–2.5 ng; (D) H and E staining of control, rbm24a AUG MO at 1.0–1.2 ng, and rbm24a AUG MO at 2.0–2.5 ng; (E) Phenotypes of control, crim1 AUG MO at 1.0–1.5 ng, and crim1 AUG MO at 2.5–3.0 ng; Same magnification as (A); (F) H and E staining of control, crim1 AUG MO at 1.0–1.5 ng, and crim1 AUG MO at 2.5–3.0 ng. Same magnification as (B); (G) VIZN analysis of control (n = 19), rbm24a AUG MO at 1.0–1.2 ng (n = 18), and rbm24a AUG MO at 2.0–2.5 ng (n = 10) (Mann–Whitney p-value ** = 0.0068, *** = 0.0003); (H) VIZN analysis of control (n = 39), crim1 AUG MO at 1.0–1.5 ng (n = 31), and crim1 AUG MO at 2.5–3.0 ng (n = 18) (Mann–Whitney p-value **** < 0.0001). Yellow arrow indicates lens staining. Light blue arrow denotes ganglion cell layer staining. Dark blue arrow indicates choroid staining. Black arrows point to microphthalmic eyes. White arrow indicates cardiac edema. Scale bars in (A) and (B): 0.04 mm, and in (D) and (F): 0.05 mm.