
Image
|
Figure Caption
Fig. 6
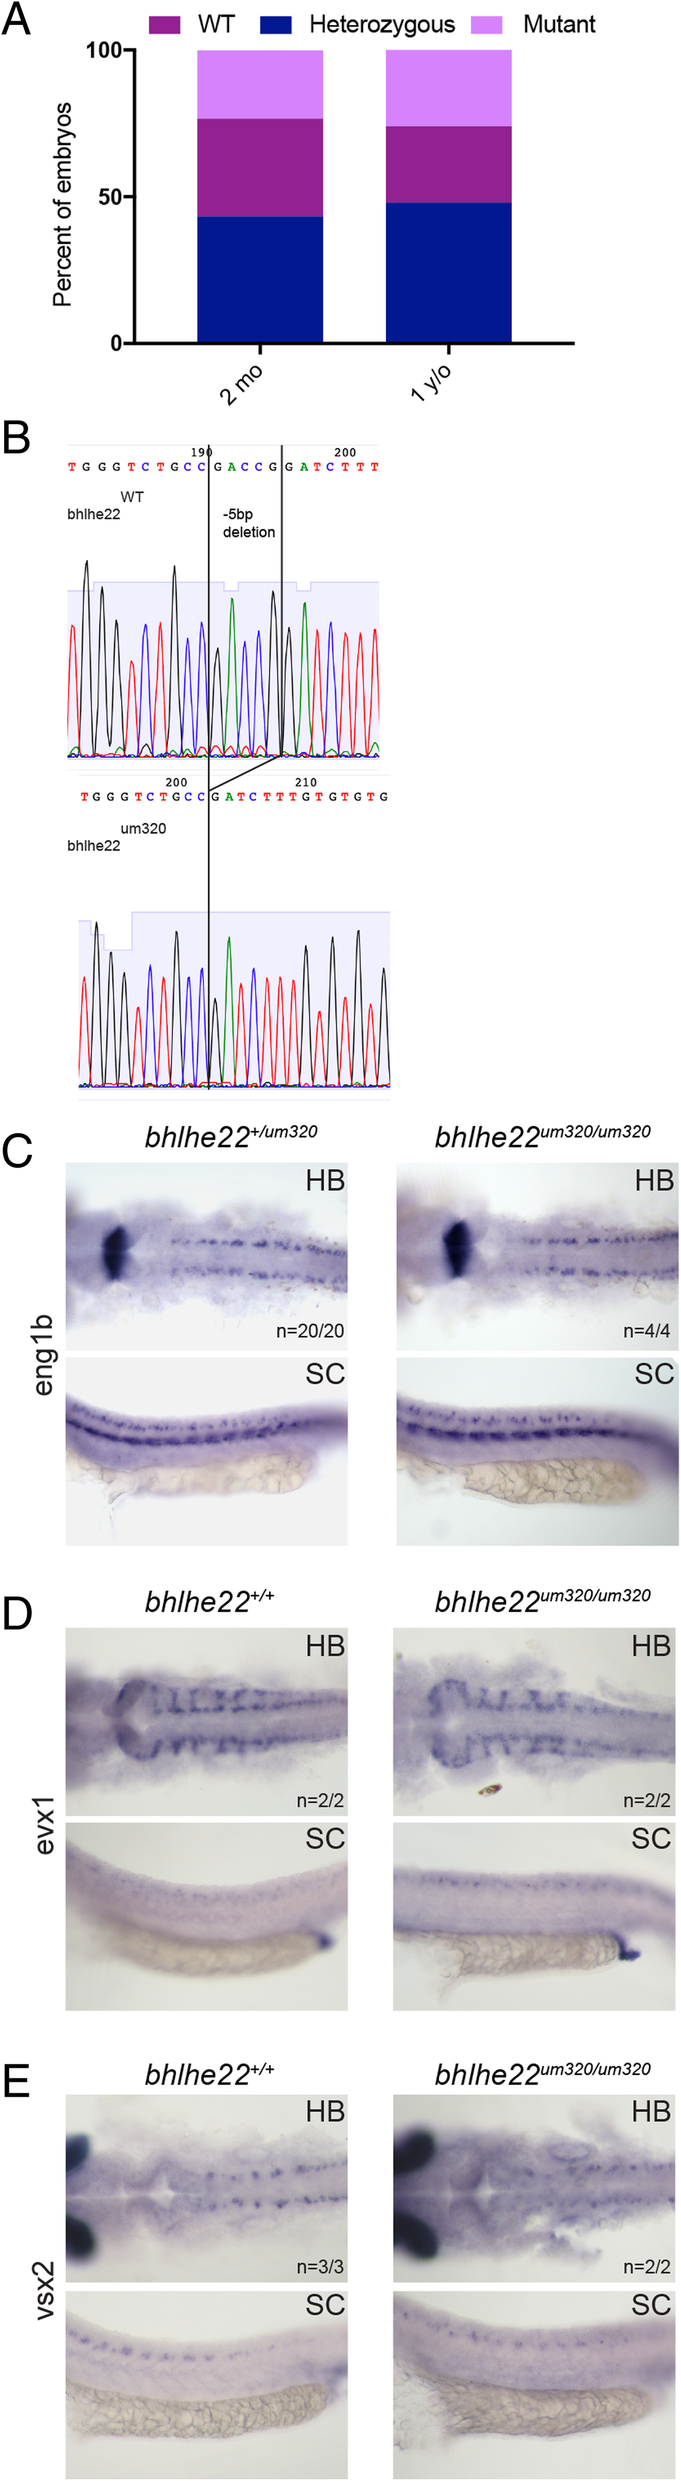
Analysis of bhlhe22 mutant zebrafish. a. Chart depicting the frequency of each genotype at various timepoints in broods from crosses of bhlhe22+/um320 heterozygous fish. mo = month, y/o = year old. b. Sequencing traces of transcripts from wild type versus bhlhe22um320/um320animals showing the expected 5 bp deletion. c-e. Expression of eng1b (c), evx1 (d) and vsx2(e) in 24hpf wildtype and bhlhe22um320/um320 mutant embryos
Figure Data
Acknowledgments
This image is the copyrighted work of the attributed author or publisher, and
ZFIN has permission only to display this image to its users.
Additional permissions should be obtained from the applicable author or publisher of the image.
Full text @ Neural Dev.