
|
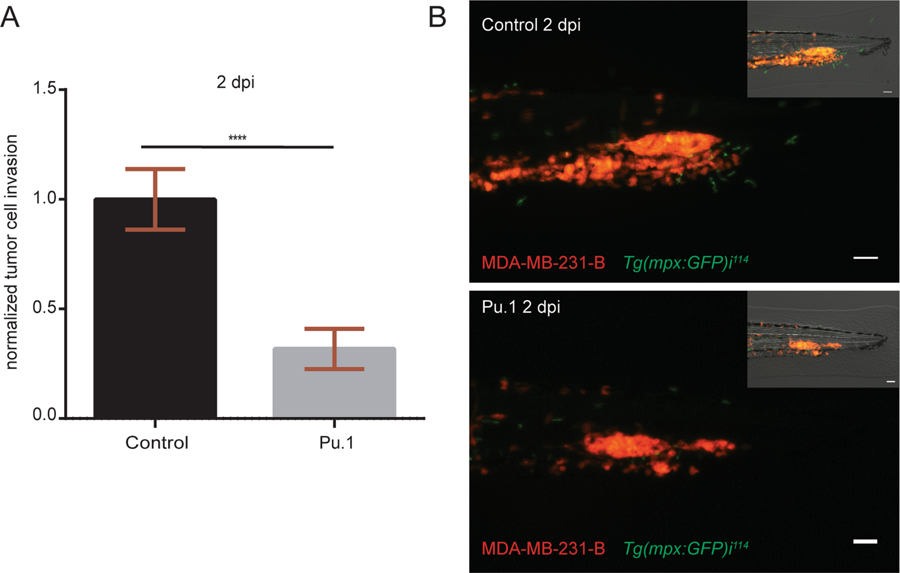
Fig. 1
Myeloid cell depletion impairs tumor cell invasion. (A) Relative tumor invasion was compared at 2 dpi in Pu.1 morphants, depleted of neutrophils and macrophages, and larvae injected with control morpholino (68% inhibition). Two-tailed un-paired t-test with Welch’s correction (****p < 0.0001) was performed on a pool of two biological replicates (Control: n = 84, Pu.1: n = 67). Data are mean ± SEM. (B) Top panel shows MDA-MB-231-B cells forming a tumor mass and invading the tail fin tissue (bright field image, top right), while surrounded by GFP expressing neutrophils in 2 dpi Tg(mpx:GFP)i114 injected with a control morpholino. In the bottom image, neutrophils are absent due to Pu.1 knockdown and a smaller tumor mass is formed compared to the control condition, resulting in impaired invasion of the local tissue (bright field, top right). Scale bar: 50 µm. Micrographs were acquired using a Leica MZ16FA fluorescent microscope coupled to a DFC420C camera.