
|
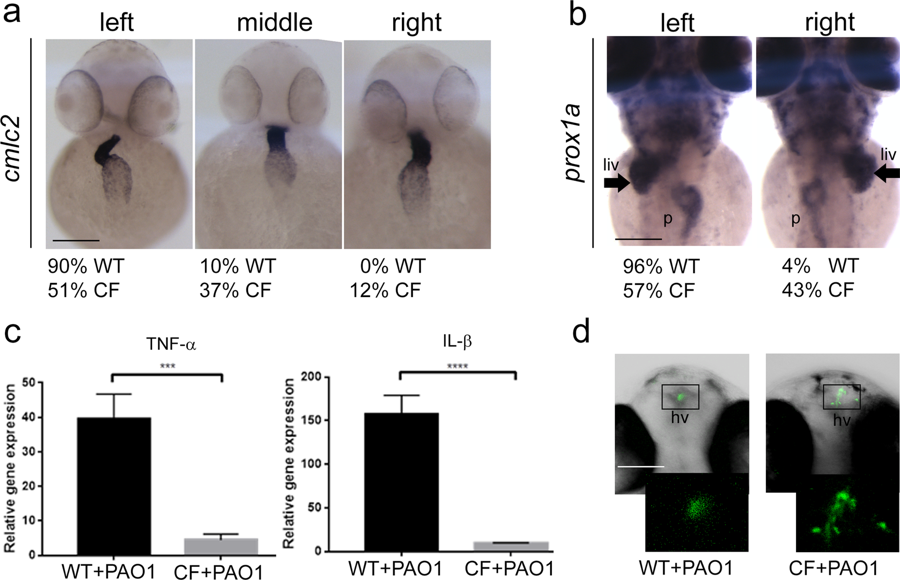
Fig. 2
Validation of CF embryos. (a,b) Impaired internal organ position in CF injected embryos. (a) The normal left-looping of the heart (ventral view of the embryo, visualized by means of cmlc2 in-situhybridization techniques), and (b) the normal left-position of the liver (arrows, dorsal view of the embryo visualized by means of prox1a in-situ hybridization techniques), were impaired in CF injected embryos in comparison to controls. Scale bars indicate 100 μm. liv: liver; p: pancreas. (c) Induction of TNF-α and IL-β. Expression levels, measured by RT-qPCR analyses at 8 hpi, in 48 hpf WT and CF embryos injected with PAO1 (+PAO1) are given relative to the average levels measured in mock injected controls. One tailed t-test: t[4] = 7.62, p = 7.9E10−4 (TNF-α); t[4] = 15.26, p = 5.4E10−5 (IL-β). (d) PAO1 microcolony formation in the hindbrain ventricle of WT and CF zebrafish embryos. The amount of microcolonies in the CF background at 18 hpi was higher compared to the WT siblings injected with the same amount of PAO1 (100 cfu). Scale bar indicates 100 μm. hv: hindbrain ventricle.