
|
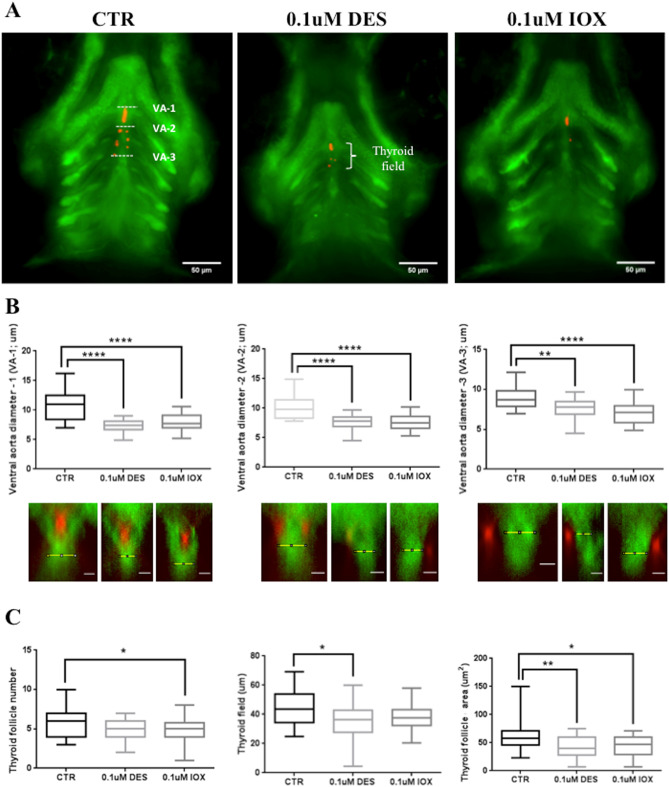
Fig. 2
Exposure to DES and IOX affects thyroid gland and ventral aorta development. (A) Fluorescent images of the pharyngeal region of Tg(fli1:EGFP) zebrafish embryos at 72 hpf. Red and green represent, respectively, thyroglobulin and GFP immunostaining. (B) Determination of aorta diameter in three different regions as depicted in A. From left to right VA-1, VA-2 and VA-3 are represented. The lower panel below the graphs represents examples of Z-slices at each region of the aorta measured. The scale bars in the lower panel below the graphs correspond to 5 μm. (C) Measurements of thyroid follicle number, thyroid field length and the thyroid follicle area.