
Image
|
Figure Caption
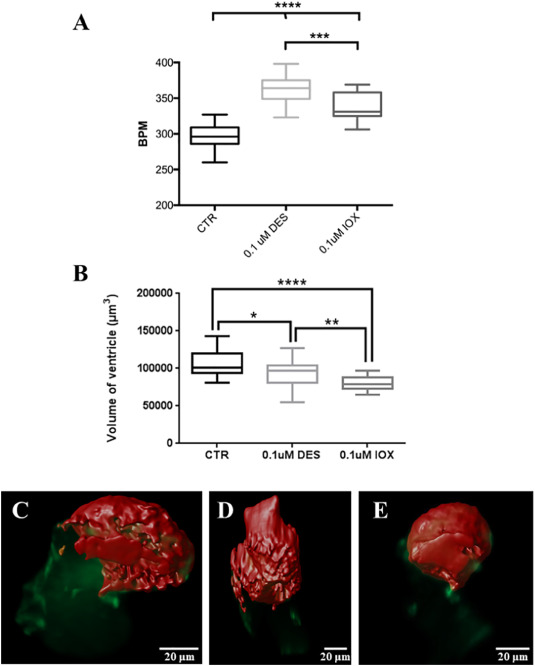
Fig. 1
Box and whisker plot (minimum and maximum) of (A) heart beats per minute (BPM) and (B) ventricle total volume in 48 hpf zebrafish Tg(fli1:EGFP) control (CTR) and 36 h-exposure embryos to DES and IOX. Different letters indicate statistically significant difference (P < 0.05). C–E Image of the heart with the ventricle (Red) at the top and atrium (Green) at the bottom, (C) control, (D) DES treated and (E) IOX treated. One-way ANOVA was used to test for statistical significance followed by Bonferroni's multiple comparisons test *P < 0.05; **P < 0.01; ***P < 0.001; ****P < 0.0001, the same as below.
Acknowledgments
This image is the copyrighted work of the attributed author or publisher, and
ZFIN has permission only to display this image to its users.
Additional permissions should be obtained from the applicable author or publisher of the image.
Full text @ Environ. Int.