
Fig. 1
- ID
- ZDB-IMAGE-190618-15
- Genes
- Publication
- Borga et al., 2018 - Simultaneous B and T cell acute lymphoblastic leukemias in zebrafish driven by transgenic MYC: implications for oncogenesis and lymphopoiesis
- All Figures
- Figures for Borga et al., 2018
|
Fig. 1
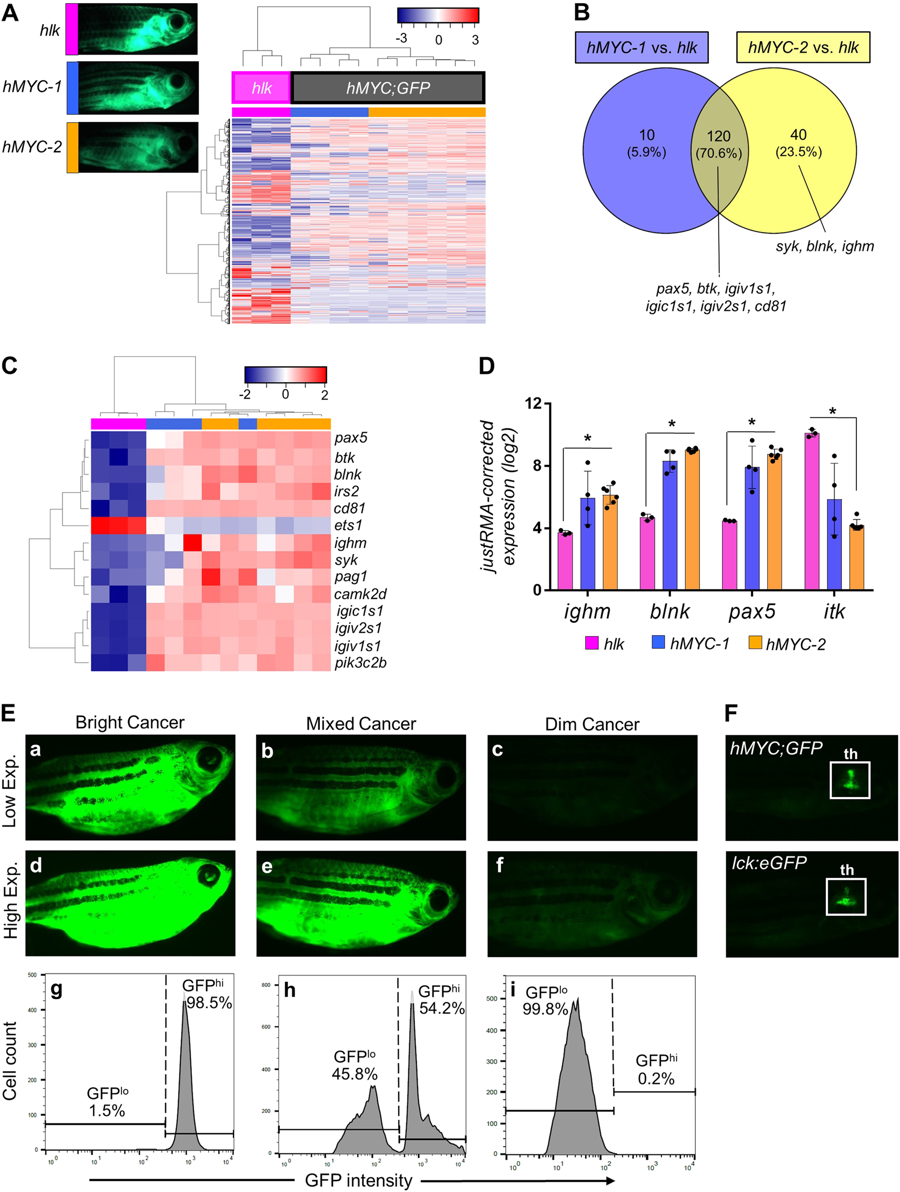
Two ALL types inhMYC zebrafish with differing fluorescence intensities. AUnsupervised analysis of 10 hMYC (grey) and 3 hlk (magenta) ALL, using highest-variance probes. hMYC ALL cluster into hMYC-1 (blue) and hMYC-2 (orange) groups. Representative fluorescent images of fish with ALL from each group shown at upper left. B Venn diagram of 170 over-expressed genes in hMYC ALL compared to hlk T-ALL. Genes up-regulated by both hMYC-1 and −2 (n = 120) reside in the intersection, including six B cell-specific genes listed below the Venn diagram. Three other B cell-specific genes over-expressed by only hMYC-2 ALL are listed below the yellow circle. C Unsupervised analysis using B cell-specific genes. D Expression of ighm, blnk, pax5and itk in hlk, hMYC-1 and hMYC-2 ALL. Each gene is significantly differentially expressed in hlk T-ALL vs. hMYC-2 ALL (Mann–Whitney test, *p-value < 0.05). Expression values are log2 scale, normalized against the entire microarray dataset using the justRMA algorithm. Results shown as mean values ± standard deviation (S.D.). E Left: “bright” ALL, shown using low and high exposure settings (a, d). Cells are GFPhi by flow cytometry (g). Right: “dim” ALL, using low and high (c, f) exposures. Cells are GFPlo (i). Center: Fish with mixed-ALL (b, e), with discrete GFPlo and GFPhipopulations (h). F Images of control hMYC;GFP (upper) and lck:eGFP (lower) fish with only thymic (th) fluorescence