
|
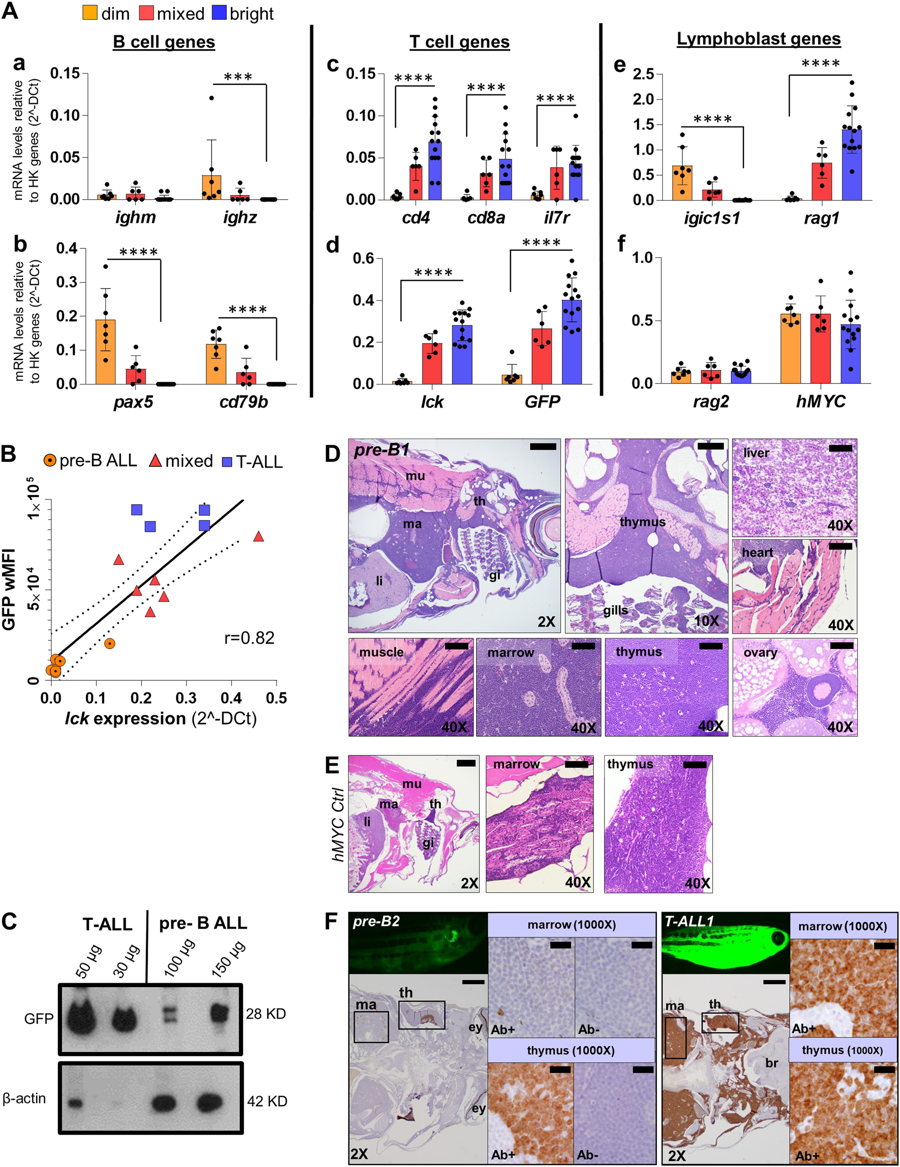
Fig. 3
GFP fluorescence intensity of hMYC ALL correlates with B vs. T cell lineage. A qRT-PCR of ALL with differing GFP fluorescence (dim, n = 7; mixed, n = 6; bright, n = 14) of B cell-specific (ighm, ighz, pax5, cd79b; a–b), T cell-specific (cd4, cd8a, il7r, lck; c-d), lymphoblast- specific (igic1s1, rag1, rag2; e–f) genes and transgenes (GFP, d; hMYC, f). Results are normalized to housekeeping (HK) genes (β-actin and eef1a1l1) and shown as mean values ± S.D. Significant differences are indicated (Mann–Whitney test, p-values: ***<0.001, ****<0.0001). B Spearman correlation (p-value 0.0002, r = 0.82, r2 = 0.74) between lck vs. wMFI for: 7 B-ALL (circles), 6 mixed (triangles), and 4 T-ALL (squares). The solid line represents linear regression; dashed lines denote 95% confidence intervals. C Anti-GFP (#sc-9996) and anti-β-actin (#ab8227) WB of FACS-purified T- and pre-B ALL. D H&E of pre-B ALL infiltration in different sites and E hMYC control. F Anti-GFP (#GTX20290) IHC of hMYC pre-B ALL (pre-B2, left) and T-ALL (T-ALL1, right). 1000× images show staining with or without anti-GFP (Ab+; Ab-). th= thymus, ma= marrow, li= liver, mu= muscle, gi= gills, ey= eye, br= brain. 2× scale bar = 500 µm; 10× bar = 100 µm; 40× bar = 50 µm; 1000× bar = 20 µm