
|
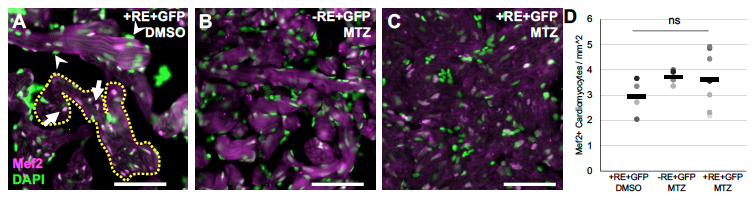
Fig. S11
Quantification of cardiomyocyte number and cell size in adult hearts. A-C) Examples of microscopy sections of ventricles stained with Mef2 and DAPI. Scale bar =15uM. Nuclei that are both Mef2 and DAPI positive (arrows in A) were used to count the number of cardiomyocytes per area defined by a ROI selection of the auto fluorescent trabecular myocardium, an example ROI selection is shown by yellow dashed line. Non-cardiomyocyte nuclei that were green only (arrowheads in A) were not counted. D) Cardiomyocyte numbers quantified from microscopy sections. Dots represent individual adult section measurements and bars the mean of each sample. ns = not significant from standard two-way T-test.