
|
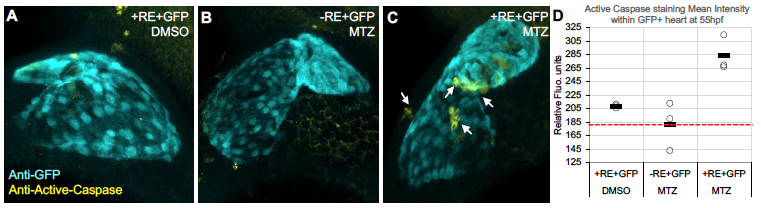
Fig. S5
Cell death in NC-Cms after MTZ treatment. Embryos derived from transgenic crosses as described in Figure 1 and 2A. A) Control: DMSO treated double transgenic siblings. B) Control: MTZ treated single transgenic siblings. C) MTZ treated double transgenic (+RE+GFP) had positive staining for Active Caspase 3, indicative of cell death (arrows), that was not observed in hearts from controls. D) Quantitation of active Caspase staining signal in control and ablated embryos at 55hpf. Bars indicate mean of n=3 individual heart images (open circles). Red dashed line indicates background level of fluorescent signal in detection channel for active Caspase (179 RFU).