
|
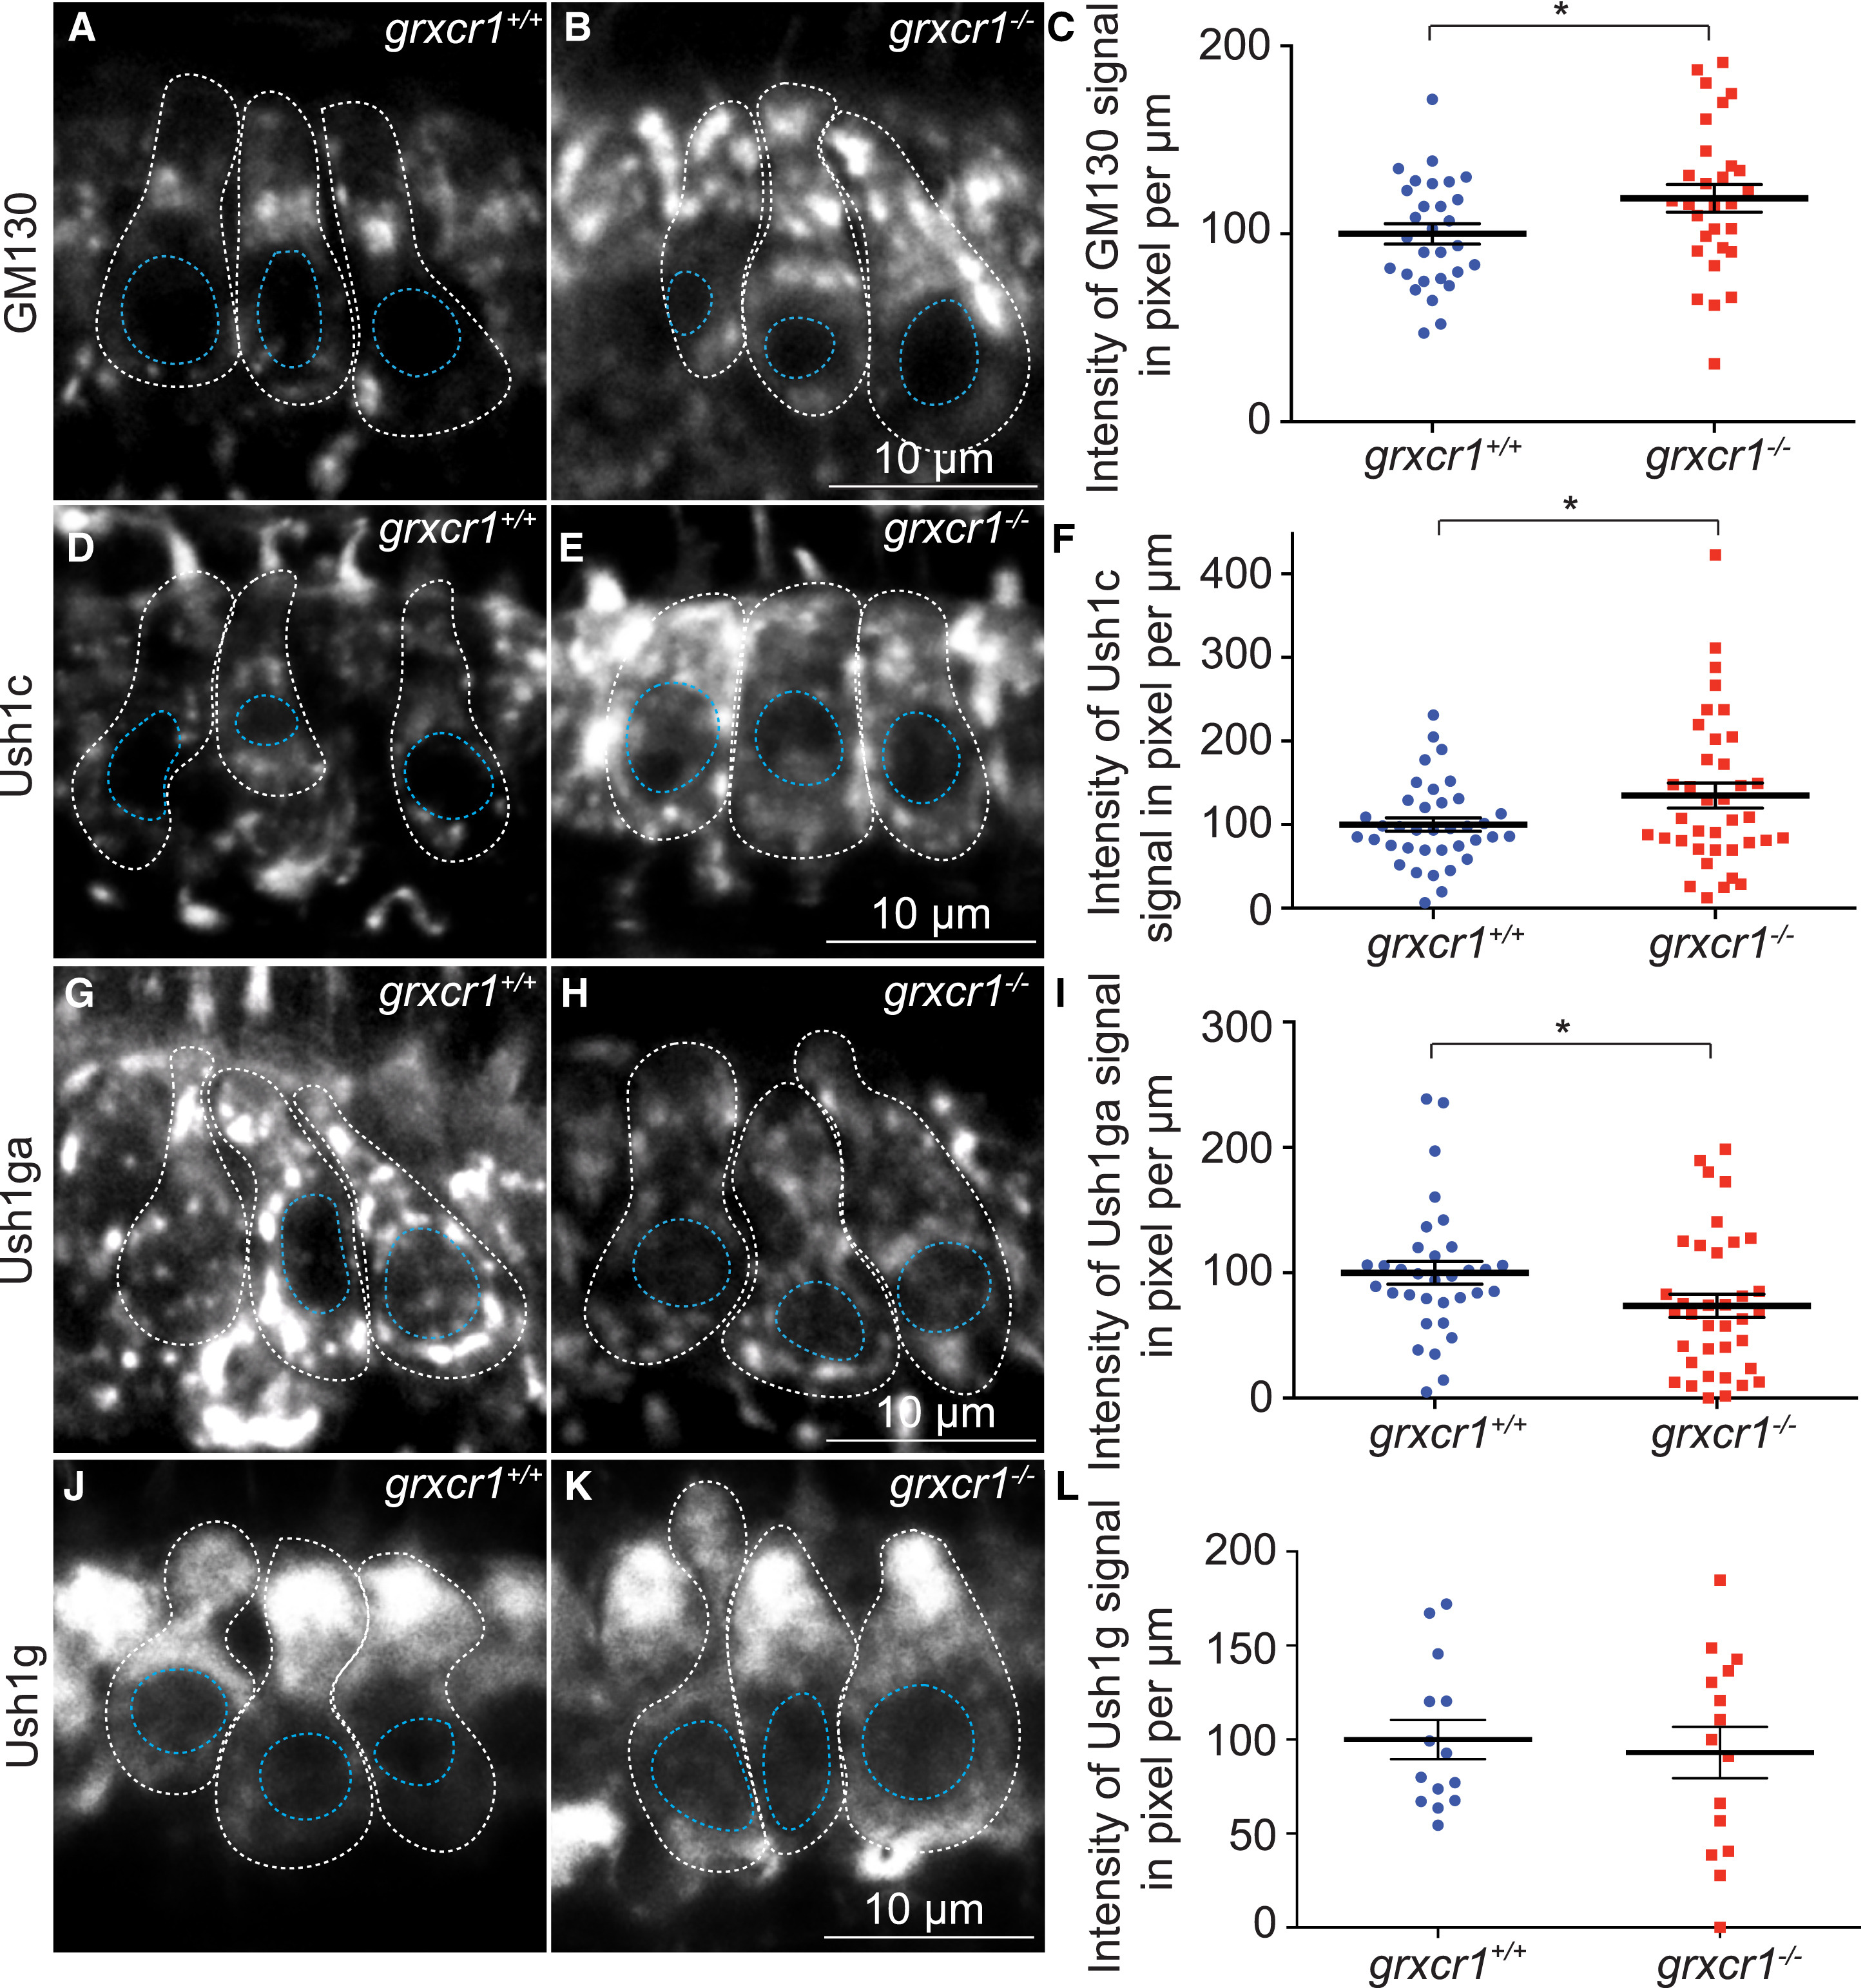
Fig. 6
The Integrity of the cis-Golgi and Abundance of Ush1c and Ush1ga Are Affected in grxcr1−/− Mutants
(A and B) Immunolabeling of GM130 in the anterior maculae of grxcr1+/+ (A) and grxcr1−/− (B).
(C) Quantification of GM130 signal intensity in grxcr1+/+ (n = 29 larvae) and grxcr1−/− (n = 29 larvae) anterior maculae.
(D and E) Immunolabeling of Ush1c in the anterior maculae of grxcr1+/+ (D) and grxcr1−/− larvae (E).
(F) Quantification of Ush1c signal intensity in the anterior macula of grxcr1+/+ (n = 37 larvae) and grxcr1−/− larvae (n = 37 larvae).
(G and H) Immunolabeling of Ush1ga in the anterior maculae of grxcr1+/+ (G) and grxcr1−/− larvae (H).
(I) Quantification of Ush1ga signal intensity in grxcr1+/+ (n = 33 larvae) and grxcr1−/− larvae (n = 36 larvae).
(J and K) Immunolabeling of Ush1g in the anterior maculae of grxcr1+/+ (J) and grxcr1−/− larvae (K).
(L) Quantification of Ush1g signal intensity in grxcr1+/+ (n = 14 larvae) and grxcr1−/− larvae (n = 15 larvae).
Data were normalized to grxcr1+/+ and are represented as mean ± SEM. ∗p < 0.05; 5 dpf.