
|
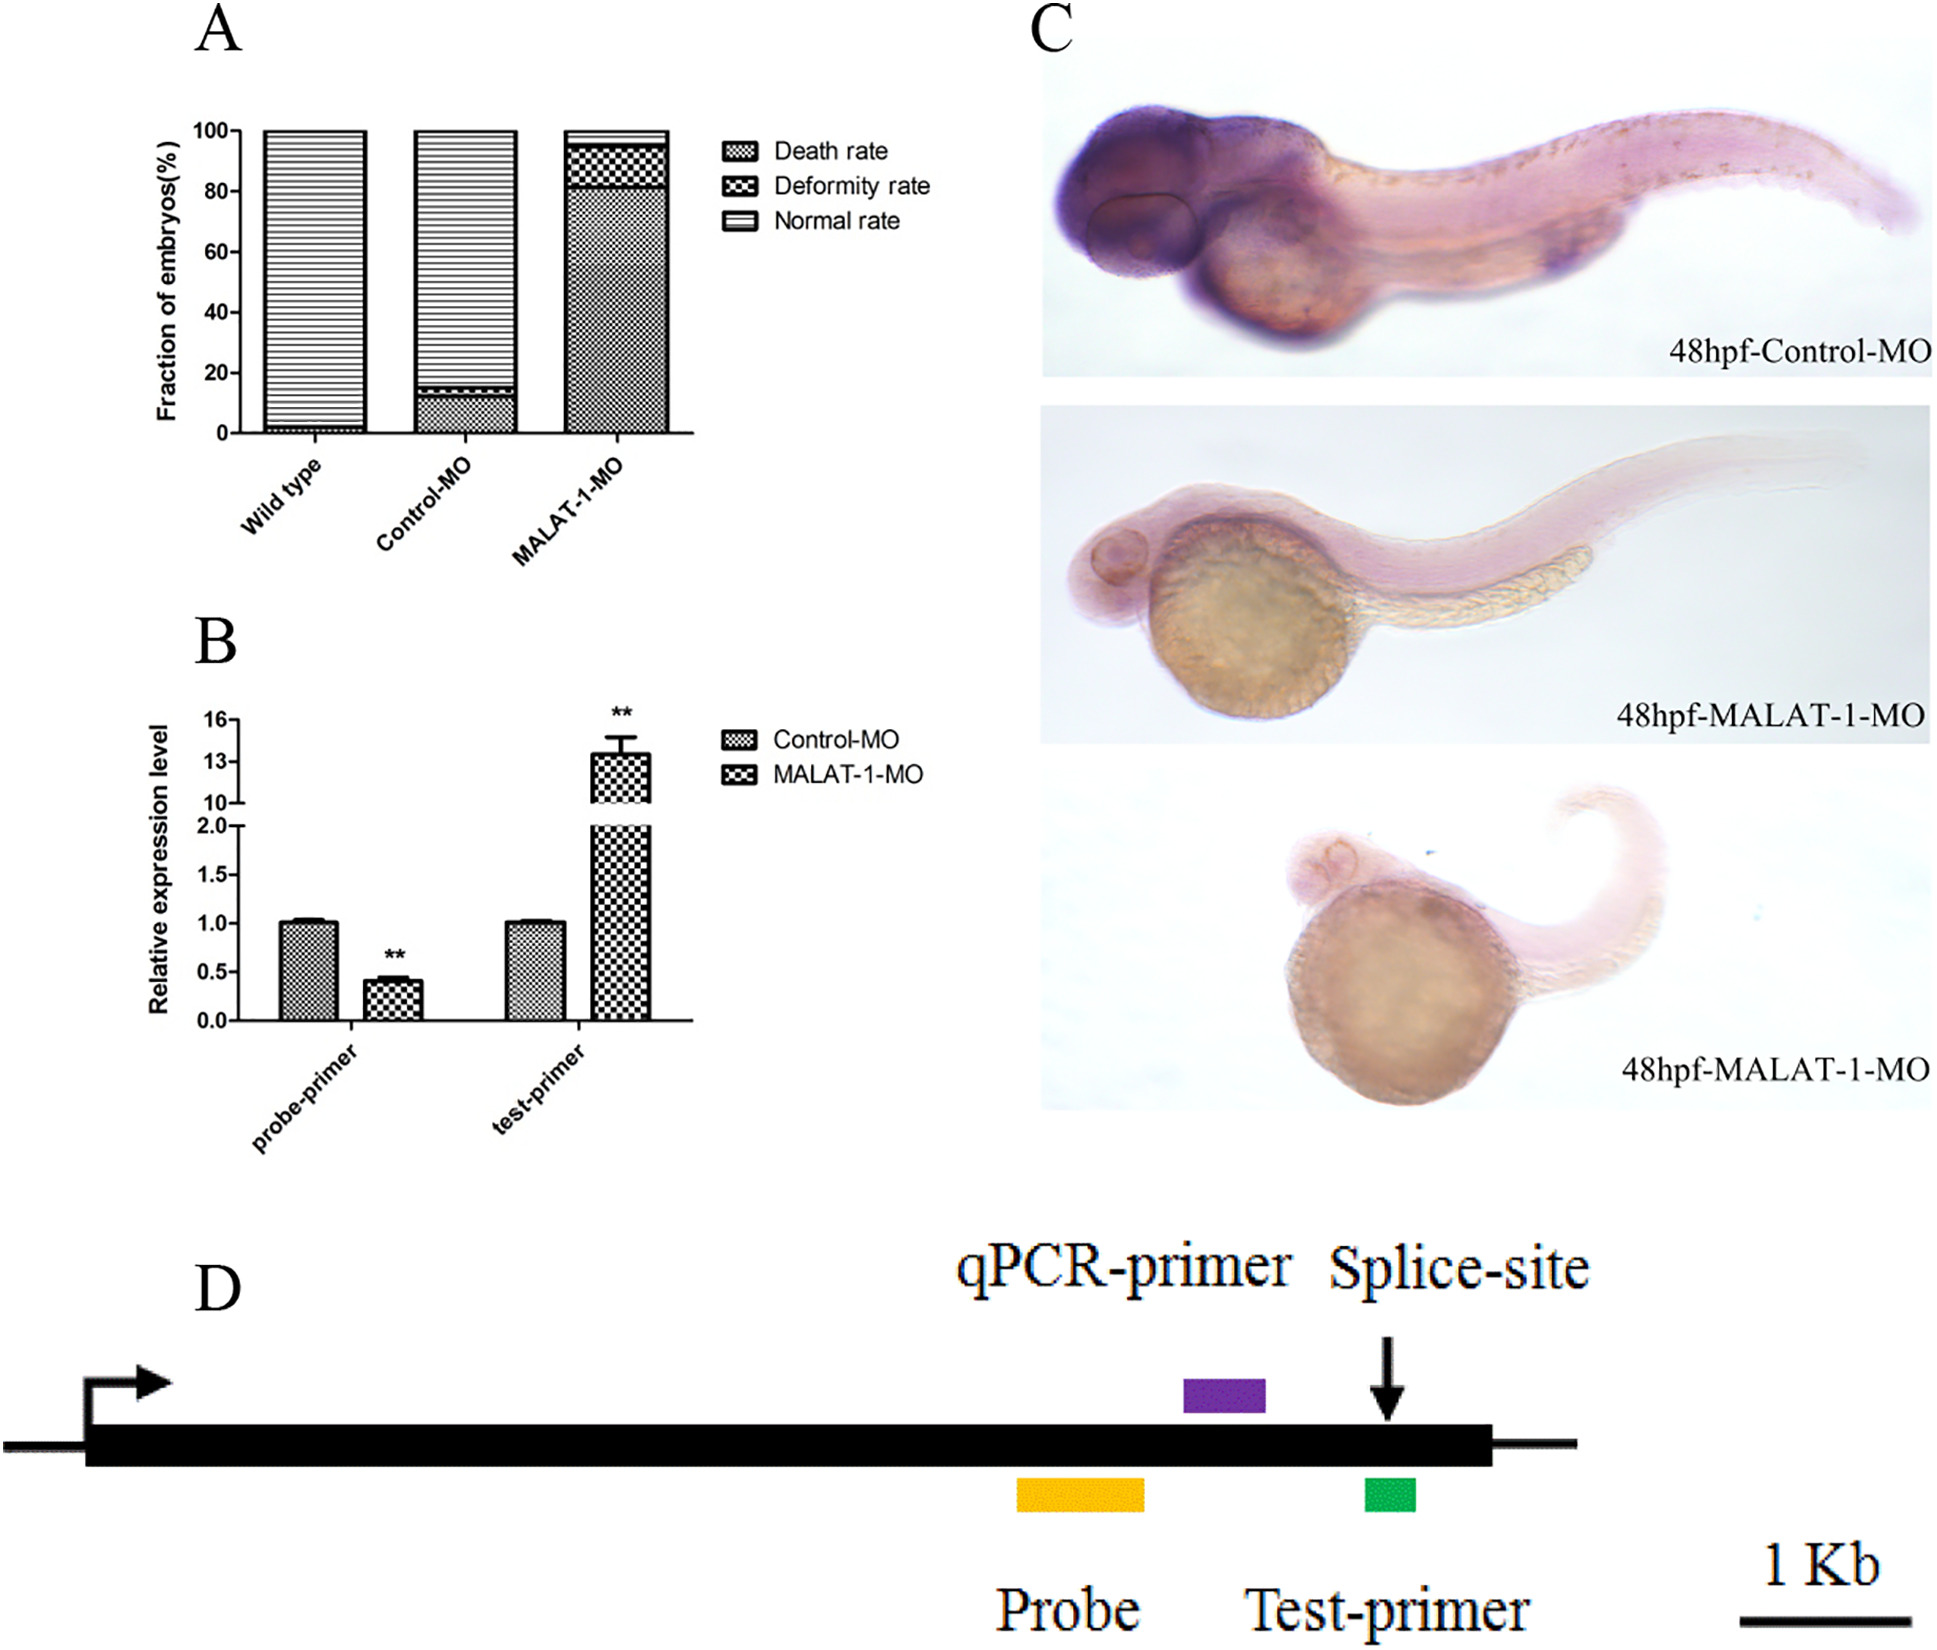
Fig. 4
Morpholino knockdown of MALAT-1 and validation.
A: Frequency of morphant phenotypes in injected embryos.
B: qPCR monitoring MALAT-1 in control-MO embryos (48 hpf) that had been injected with the indicated MOs. MALAT-1 levels were normalized to the expression of Rpl13ɑ. The data are shown as the means ± SD from three independent experiments with triplicate. Asterisk denote a response that is significantly different from the control (*p < 0.05, **p < 0.01).
C: In situ hybridization showing MALAT-1 expression in MALAT-1-MO knockdown and control-MO embryos (48 hpf).
D: Gene architecture of MALAT-1, showing the probe of in situ hybridization (yellow box), qPCR probe (purple box), test-primer (green box), cutting site, and transcription direction (arrow direction). (For interpretation of the references to color in this figure legend, the reader is referred to the web version of this article.)
Reprinted from Gene, 680, Wu, M., Zhang, S., Chen, X., Xu, H., Li, X., Expression and function of lncRNA MALAT-1 in the embryonic development of zebrafish, 65-71, Copyright (2018) with permission from Elsevier. Full text @ Gene