
Image
|
Figure Caption
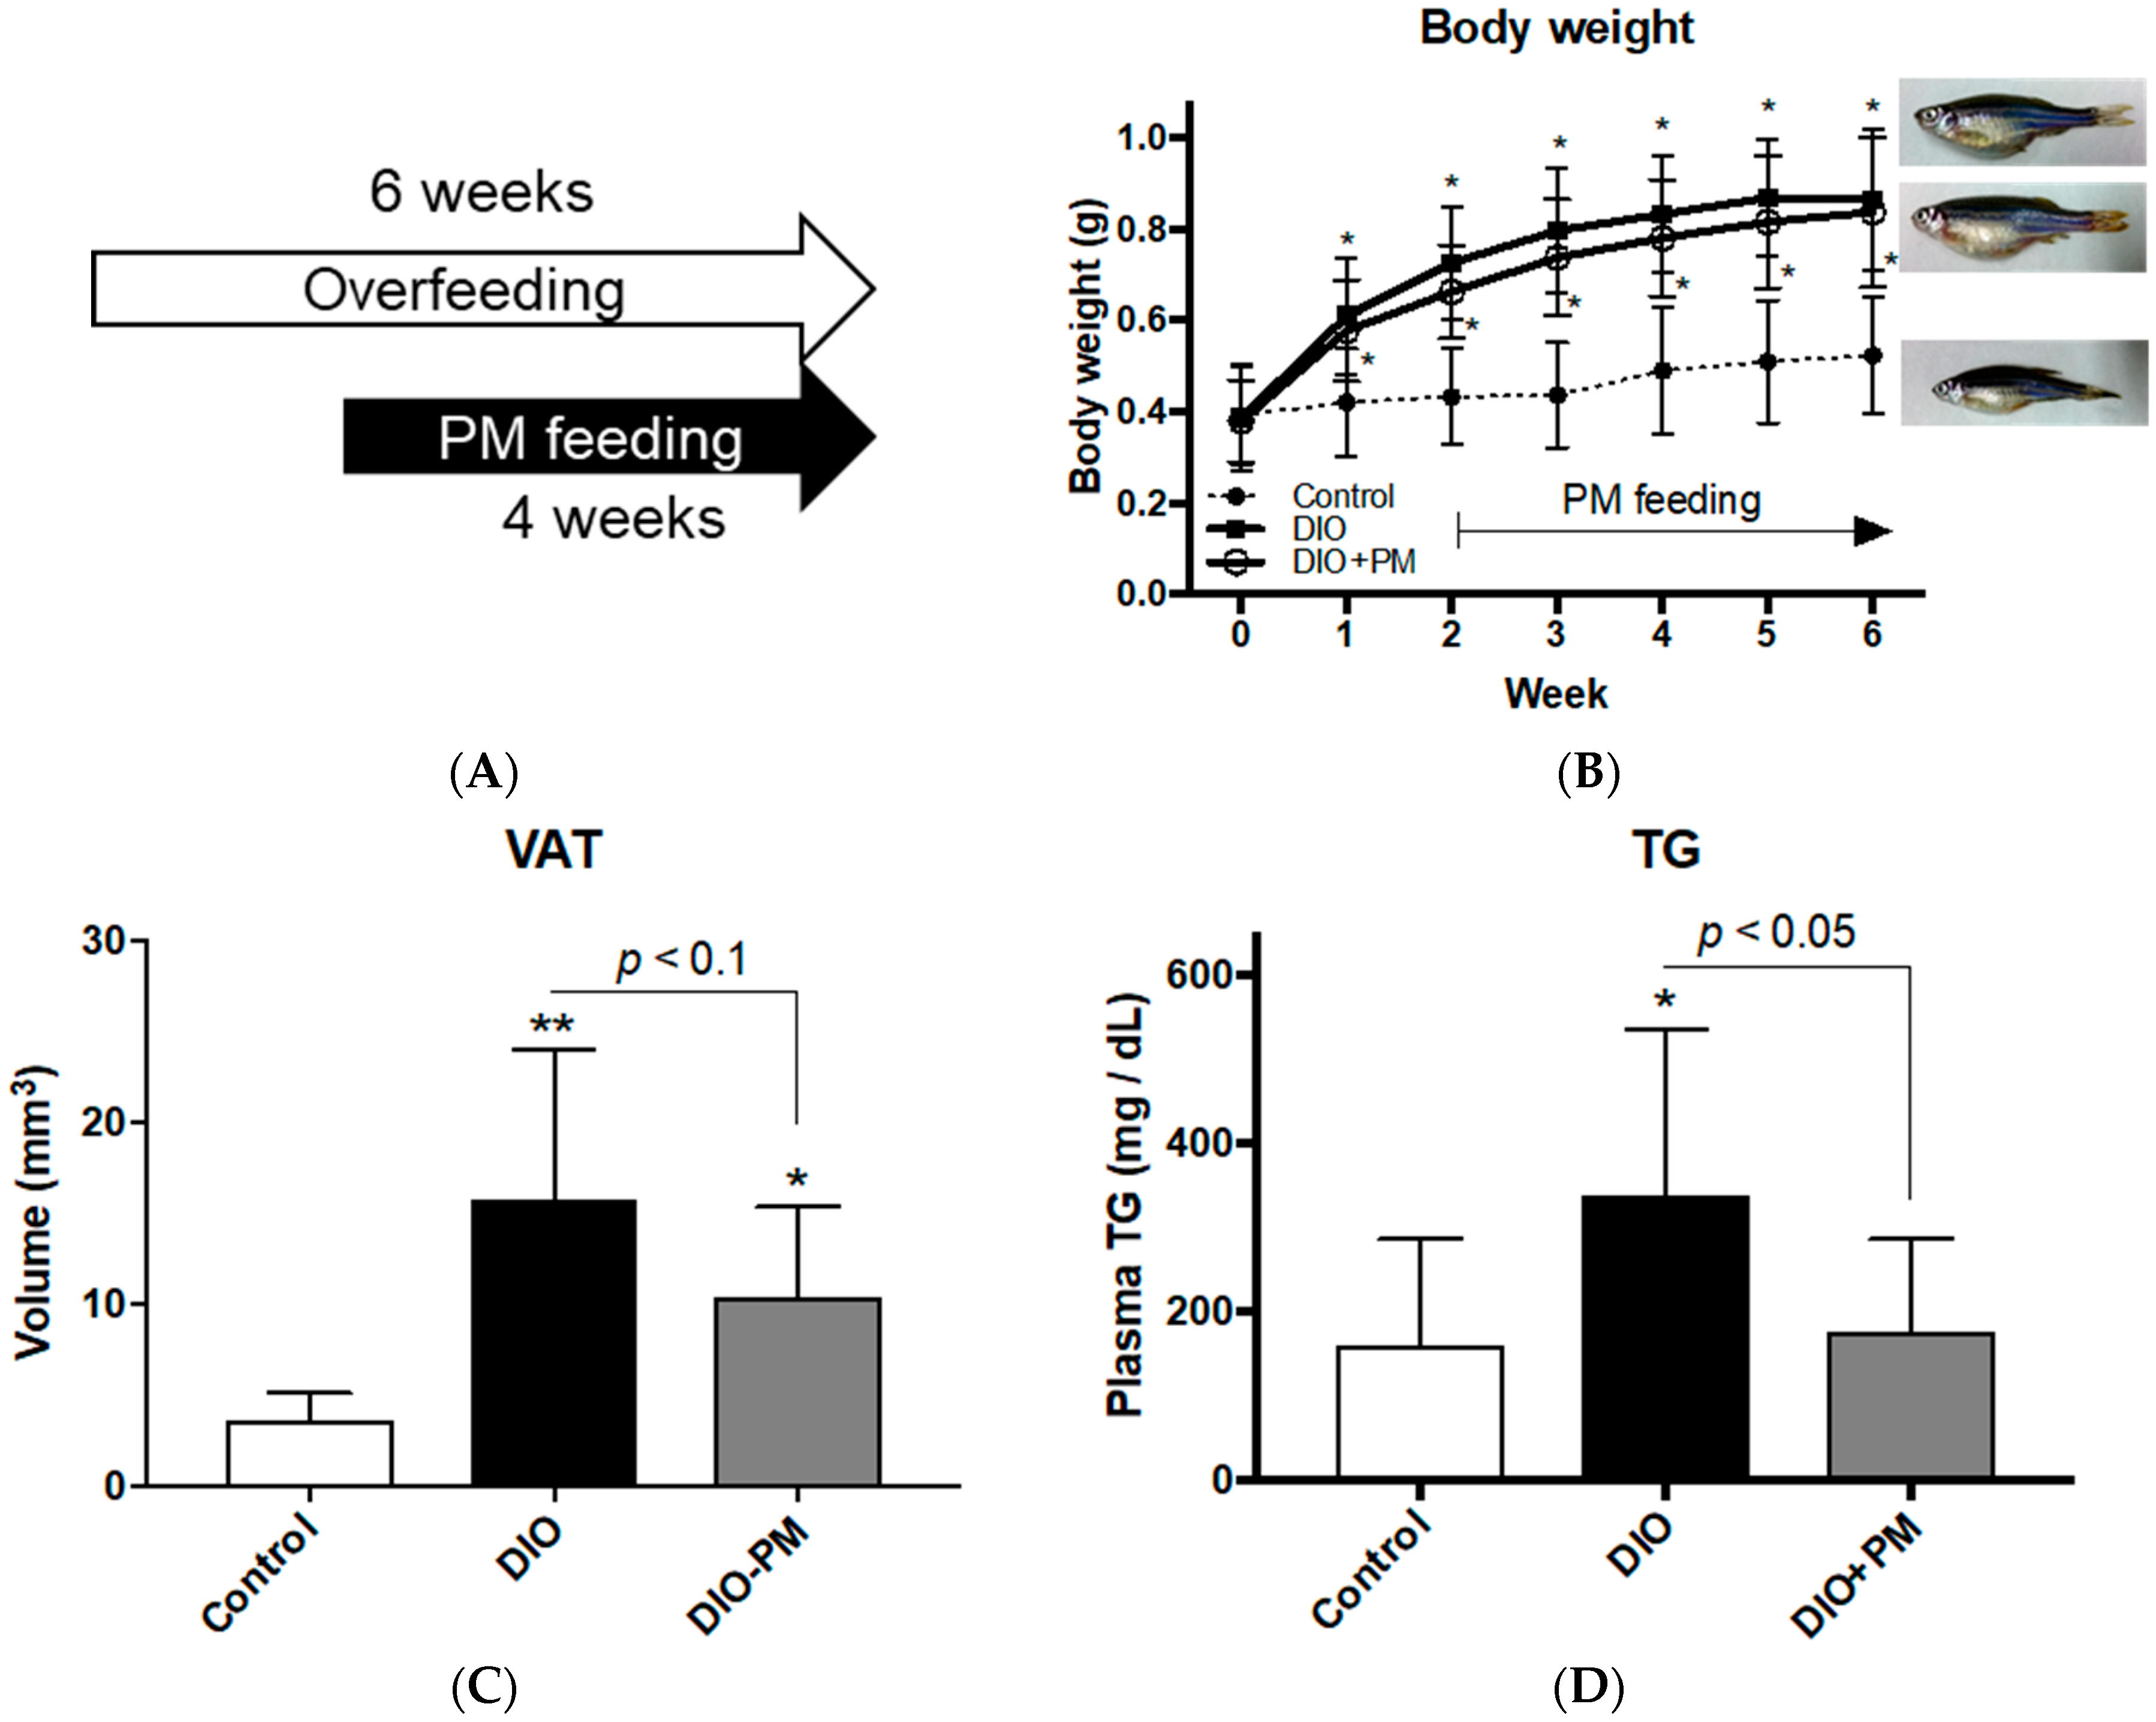
Fig. 1
Post-administration of Palmaria mollis (PM) in overfed diet-induced obese (DIO)-zebrafish. (A) Schedule of PM supplementation in zebrafish Experiment 1. Overfeeding and PM supplementation started on week 0 and 2, respectively. (B) Body weight change during Experiment 1. (C) Volume of visceral adipose tissues (VAT) in week 6. (D–E) PM suppressed increases in plasma triacylglycerol (TG; D) and low-density lipoprotein cholesterol (LDL-C; E) in DIO-zebrafish. (F) Lipid accumulation in liver tissues. Lipid droplets (red spots) increased in DIO-zebrafish compared to control. Lower graph indicates the quantification of red signals. * p < 0.05, ** p < 0.01 vs. control. n = 7–10, error bars indicate standard deviations (SD).
Figure Data
Acknowledgments
This image is the copyrighted work of the attributed author or publisher, and
ZFIN has permission only to display this image to its users.
Additional permissions should be obtained from the applicable author or publisher of the image.
Full text @ Nutrients