
Image
|
Figure Caption
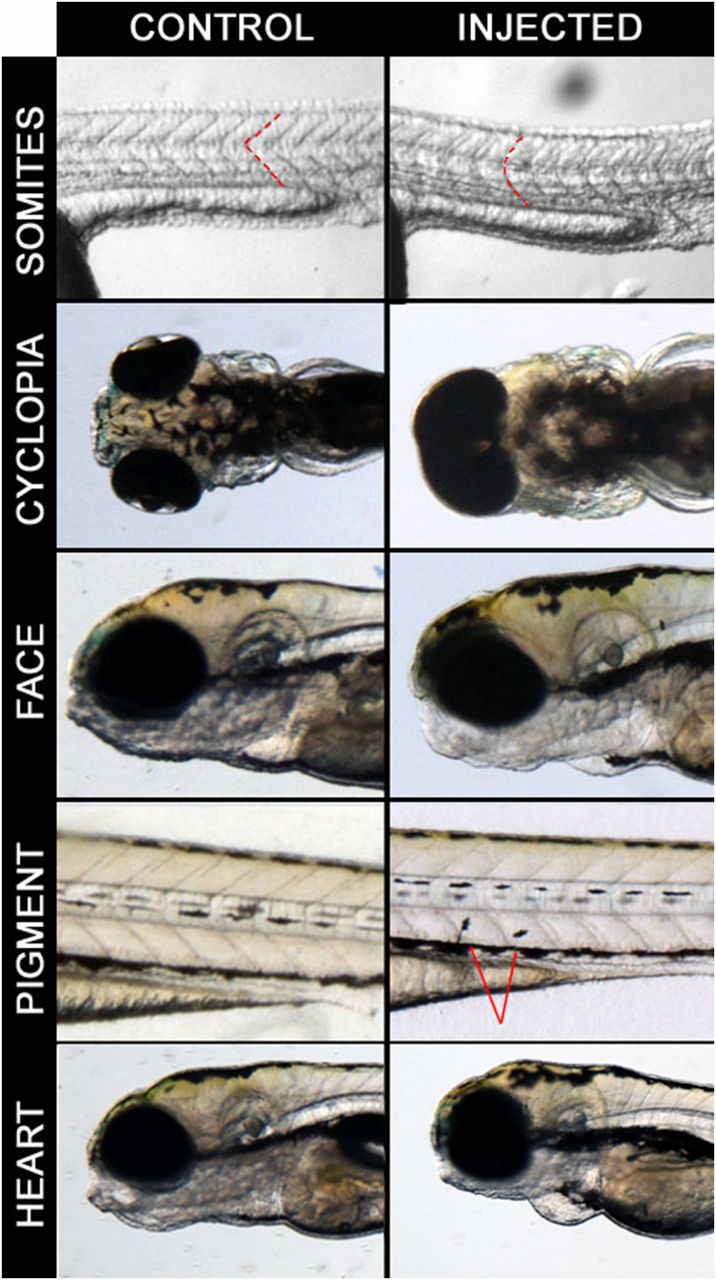
Fig. 2
Examples of phenotypes observed in the screen. Control embryos are on the left panel and injected embryos are on the right panel. Somites: RWDD2B 100pg injected embryos at 24 hpf with dashed lines to highlight somitic boundaries. Cyclopia: C21ORF84 100pg injected embryos at 5 dpf. Pigment cell migration: CCT8 100pg injected embryos at 4 dpf, arrows indicating melanocytes. Heart: JAM2 100pg injected embryos at 48 hpf.
Acknowledgments
This image is the copyrighted work of the attributed author or publisher, and
ZFIN has permission only to display this image to its users.
Additional permissions should be obtained from the applicable author or publisher of the image.
Full text @ G3 (Bethesda)