
|
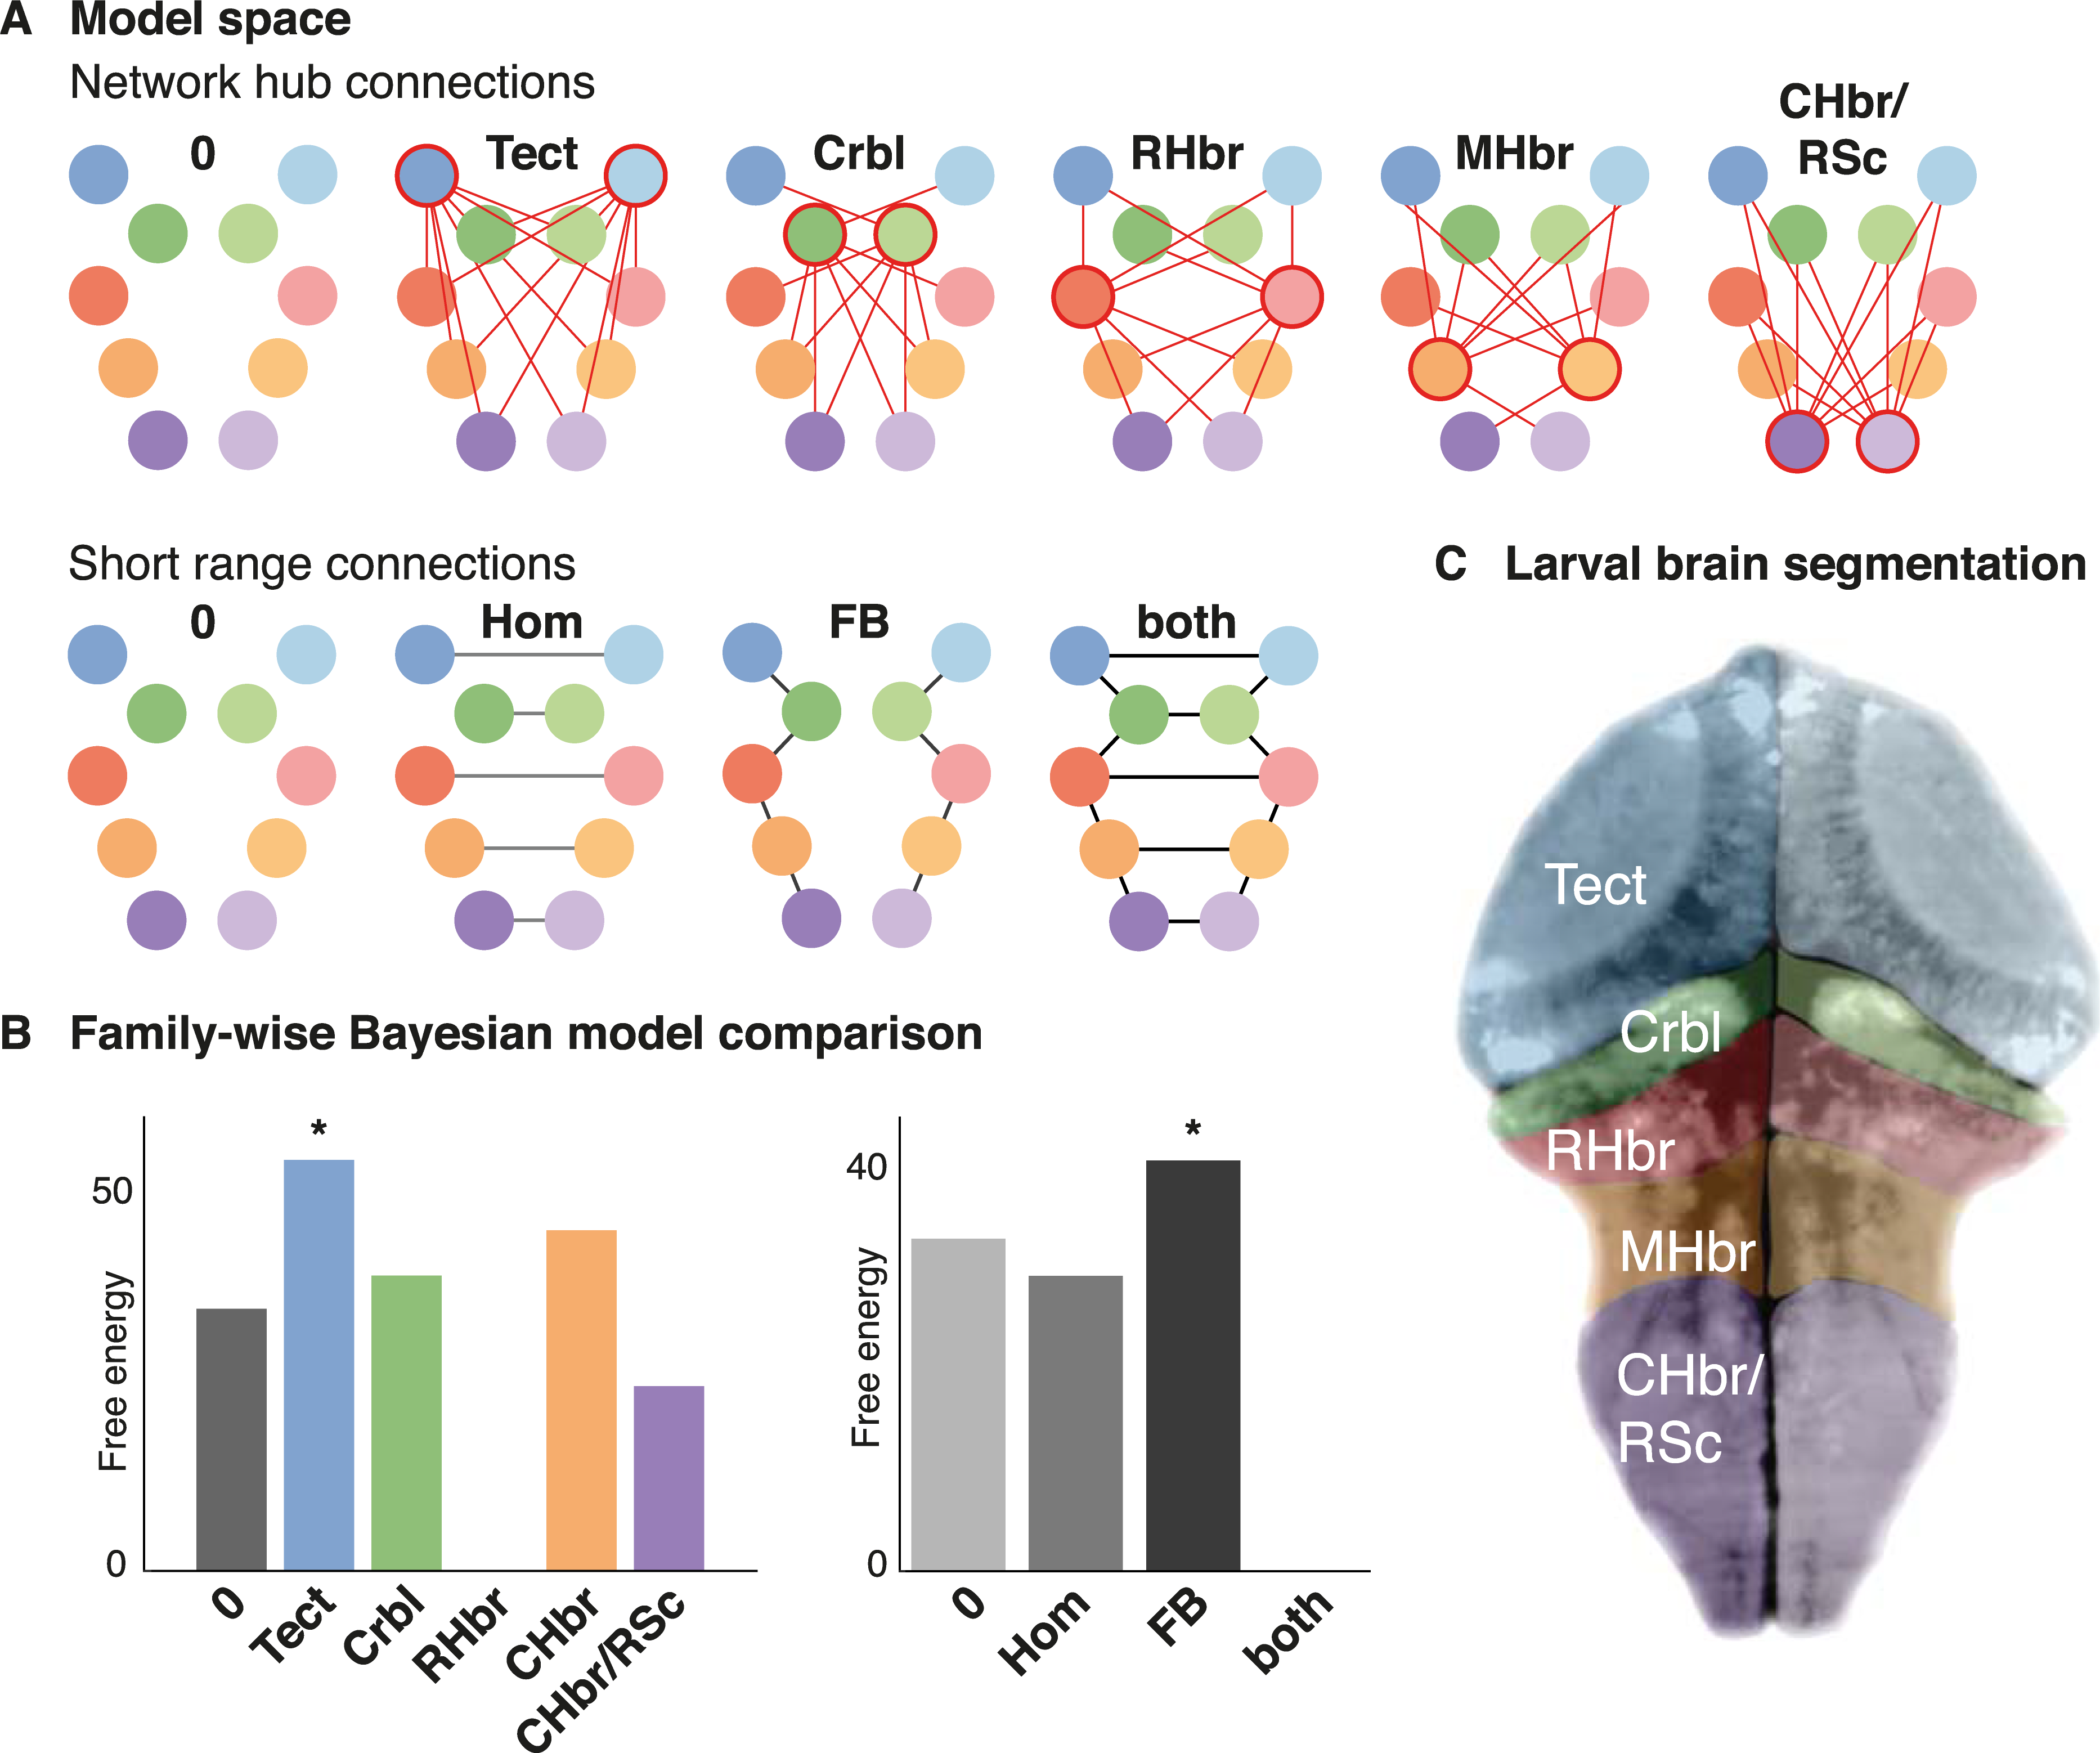
Fig. 3
Network model architecture during interictal background activity.
(A) Two aspects of a factorial model space are shown: extrinsic connectivity of putative network hubs (yielding 6 types of models), and short range connection between neighbouring and homotopic nodes (yielding 4 different types of models); a total of 6 * 4 = 24 models were evaluated, where any one model is combines one of the network hub connectivity architectures with a short-range connectivity setup. Bayesian model reduction was used to estimate the model evidence across this model space characterised by the presence or absence of these defined sets of between-region reciprocal connections (neighbouring, homotopic, and hub connections). (B) For each model family (corresponding to the factorial model space), the free energy difference to the worst-performing model is shown. In DCM, the free energy difference is used to approximate model log-likelihood differences: Asterisks indicate the winning model family identified from Bayesian model selection. These results indicate that the model with neighbouring, and homotopic connections as well as the optic tectum with hub-like connectivity best explain the observed spontaneous activity at baseline. (C) Mapping of the ROIs for this analysis is illustrated as overlay on a single fluorescence image taken from one of the animals included in this study. Areas were identified based on visible neuroanatomical landmarks and correspond to the nodes of the same colour in the network representations of the model space.