
|
Fig. 4
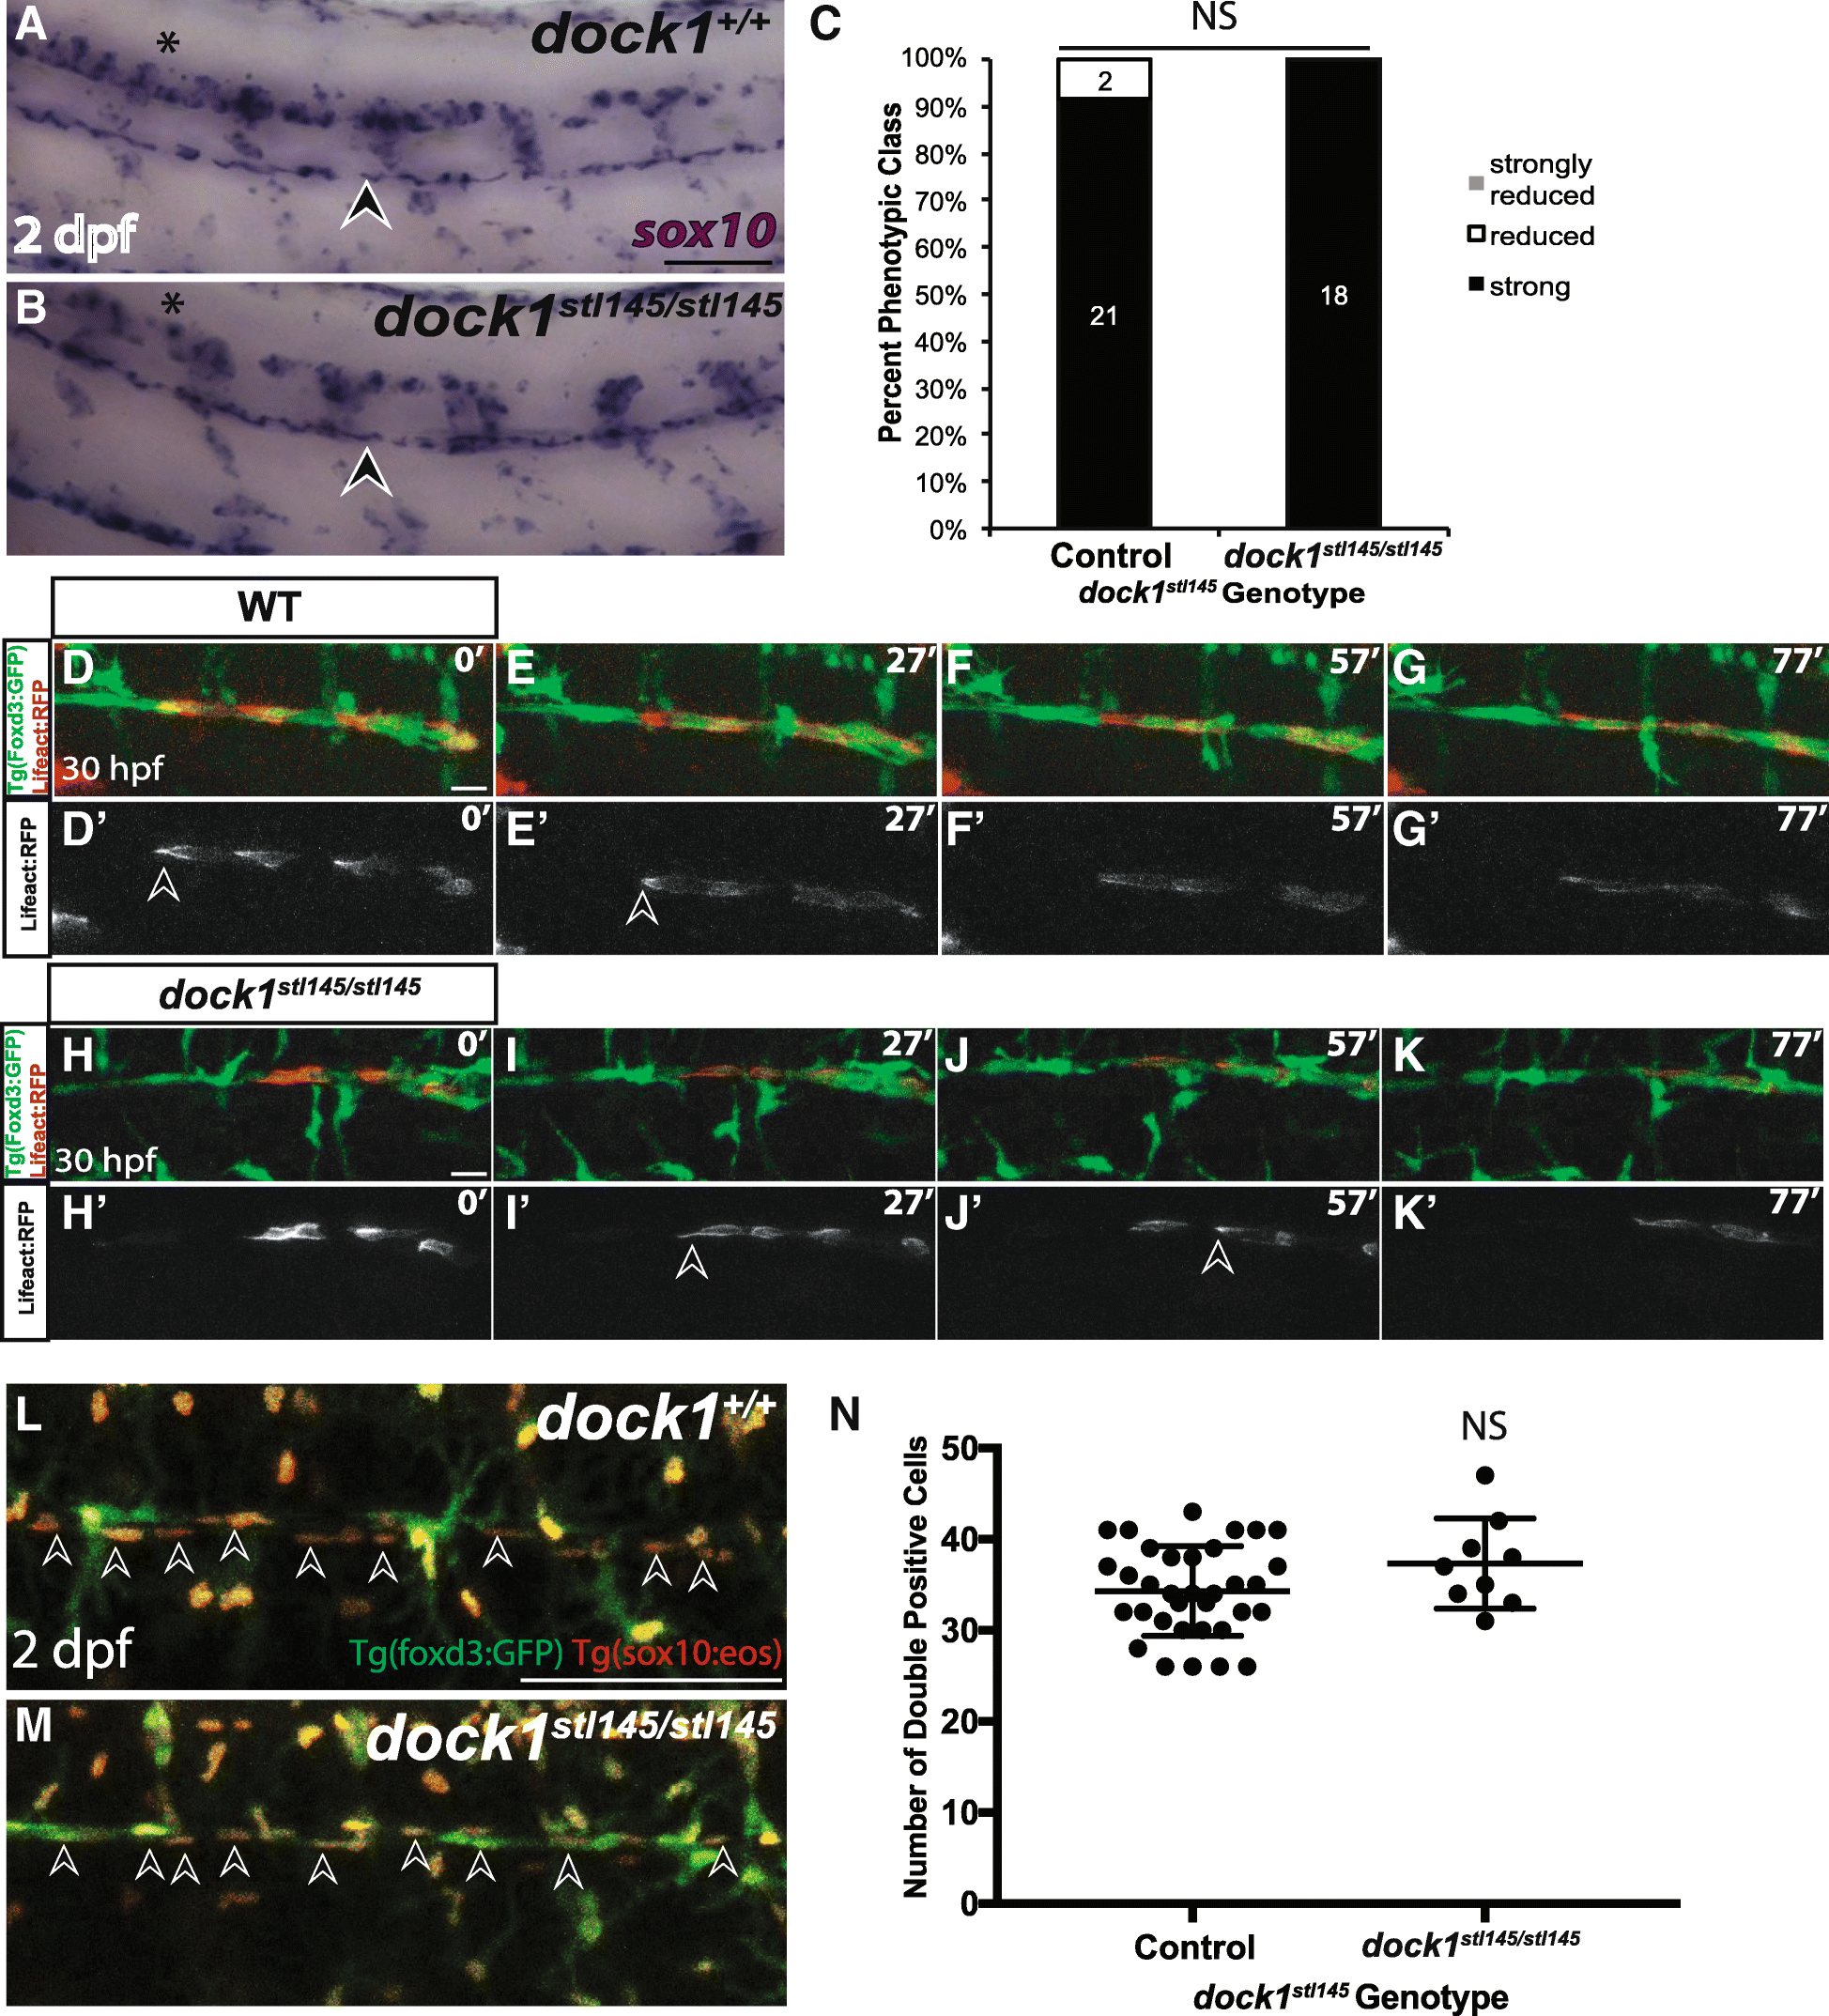
Schwann cell migration and number is not affected in stl145 mutants. a, b) Lateral view of WISH for sox10 at 2 dpf. Arrowheads indicate the PLLn. Asterisks indicate the CNS. a) Strongly expressing sox10 positive cells are located throughout the PLLn in control larvae (n = 21/23), similar to b) dock1stl145 homozygous mutant larva (n = 18). c) Quantification of WISH for sox10 at 2 dpf based on phenotypic classes and genotypes for the stl145 lesion shows no significant difference in expression (p = 0.3522, Bars represent means ± SD; Chi-squared analysis). d, g’) Still images from time-lapse imaging from 30 to 31.5 hpf in Tg(foxd3:gfp) wild-type larvae injected with sox10:Lifeact-RFP. Prime panels show Lifeact-RFP strongly localized at the back of migrating Schwann cells (arrowheads). Scale bars = 20 μm. h-k′) Still images from time-lapse imaging from 30 to 31.5 hpf in Tg(foxd3:gfp) dock1stl145/stl145 larvae injected with sox10:Lifeact-RFP. Prime panels show Lifeact-RFP strongly localized at the back of migrating Schwann cells (arrowheads). l, m) Lateral view of PLLn in 2 dpf larvae containing Tg(foxd3:gfp) and Tg(sox10(4.9):nls-eos). Arrows point to examples of double positive Schwann cells. Counting the number of Schwann cells double positive for GFP and RFP in l) control (n = 34) and m) dock1stl145 homozygous mutants (n = 9). Scale bars = 100 μm. n) Quantification of the number of Schwann cells within a defined region of the PLLn revealed no significant difference in Schwann cell number (NS, p = 0.1360). Bars represent means ± SD; unpaired t Test with Welch’s correction