
|
Fig. 4
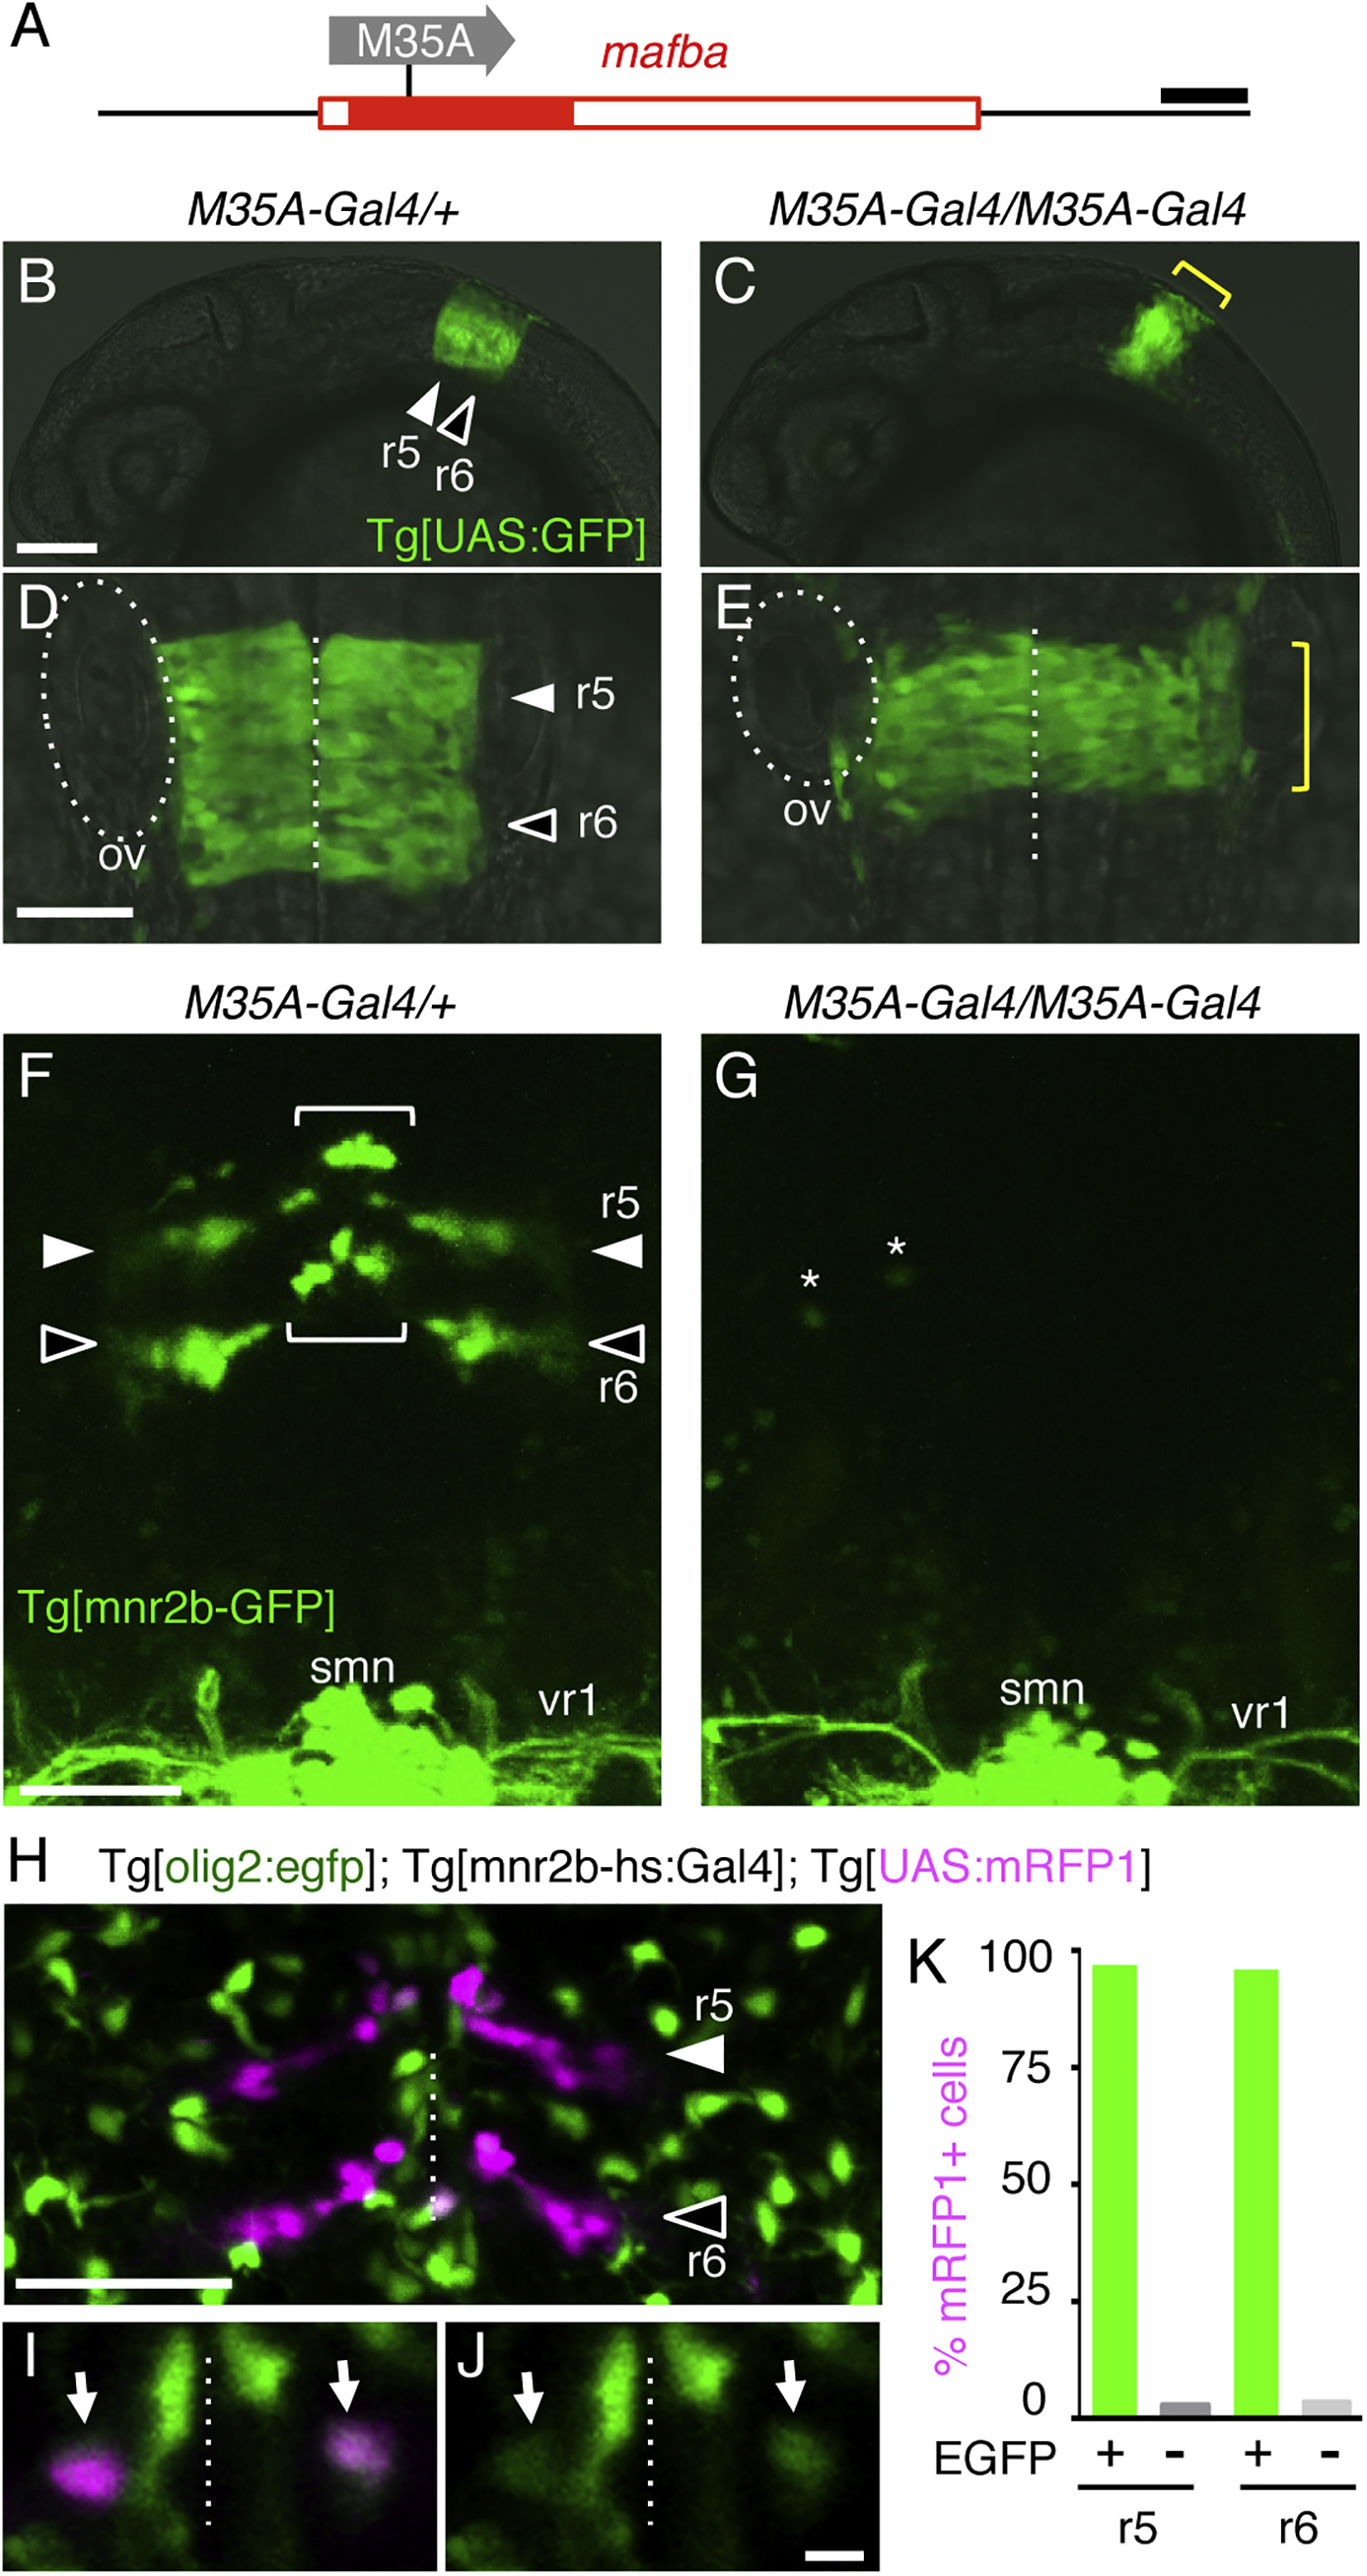
All mnr2b-ABNs Require mafba for Differentiation
(A) The mafba/valentino locus in Tg[gSAIzGFFM35A] line (valM35A-Gal4 allele). Tg[gSAIzGFFM35A] (shown as M35A) is inserted in the coding exon of mafba (filled red box).
(B–E) Lateral (B and C) and dorsal (D and E) views of the hindbrain areas of Tg[UAS:GFP]; valM35A-Gal4/+ and Tg[UAS:GFP]; valM35A-Gal4/M35A-Gal4 embryos at 24 hpf. The yellow brackets indicate the vestigial r5 and r6. Dashed lines and ovals show the midline and otic vesicle (ov), respectively.
(F and G) Dorsal views of the hindbrain and first spinal segment of Tg[mnr2b-GFP]; valM35A-Gal4/+ (F) and Tg[mnr2b-GFP]; valM35A-Gal4/M35A-Gal4 (G) larvae at 80 hpf. The brackets and arrowheads indicate the dorsal and ventral mnr2b-ABNs, respectively. Asterisks in (G) show eGFP-expressing cells unrelated to mnr2b-ABNs. smn; spinal motor neuron; vr1; ventral root from the first spinal segment.
(H) Dorsal view of r5 and r6 in Tg[olig2:egfp]; Tg[mnr2b-hs:Gal4]; Tg[UAS:mRFP1] at 3 dpf.
(I and J) A single confocal section of the dorsal hindbrain in (H). (I) Arrows show mnr2b-ABNs (magenta) expressing eGFP derived from Tg[olig2:egfp] (J).
(K) Percentage of the mRFP1-expressing cells that expressed eGFP. In total, 78 and 87 cells in r5 and r6, respectively, were examined in five larvae.
Scale bars indicate 200 bp in (A), 100 μm in (B), 50 μm in (D)–(H), and 5 μm in (I) and (J).