
|
Fig. 4
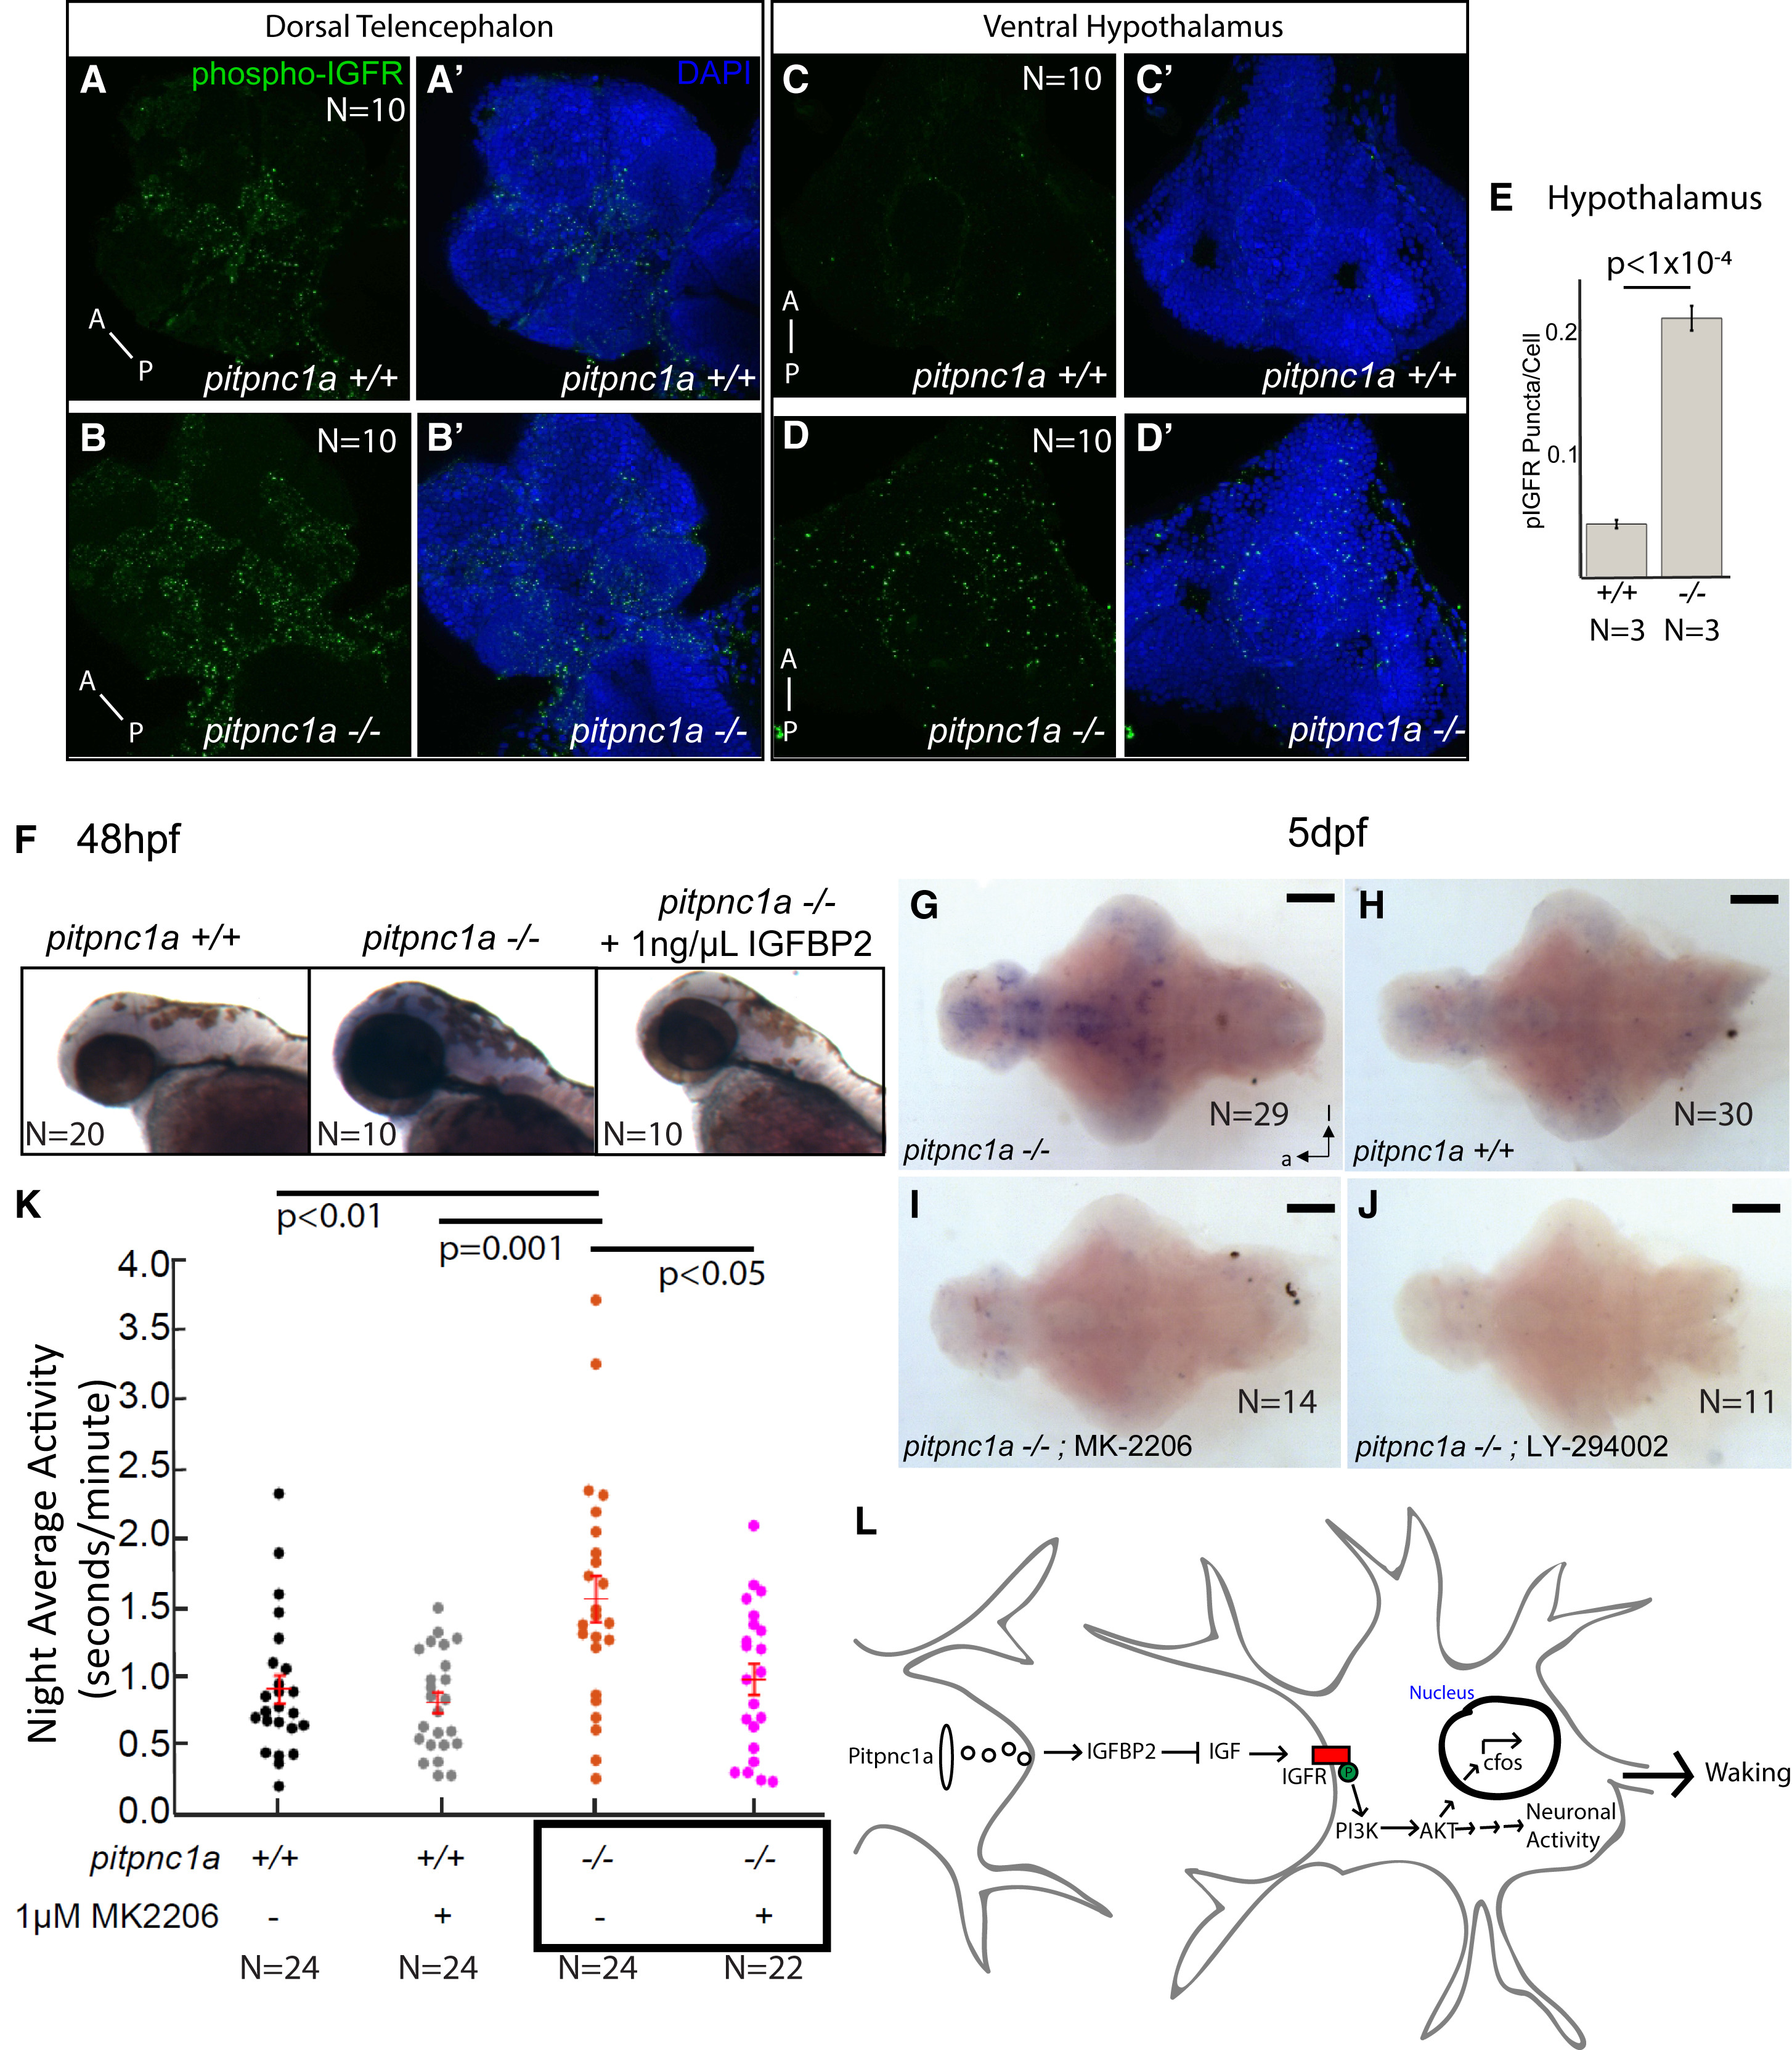
IGFR Signaling Is Enhanced in pitpnc1a−/− Brains, and Inhibiting IGFR Signaling Rescues Neuronal and Behavioral Hyperactivity
(A–E) 6 dpf pitpnc1a−/− larvae have increased pIGFR puncta in the brain. (A–B′) Confocal projections of the dorsal telencephalon in wild-type (A and A′) and pitpnc1a−/− (B and B′) reveal pIGFR puncta (green). Nuclei are DAPI stained (blue) in (A′) and (B′). Confocal projections of the pitpnc1a−/− ventral hypothalamus (D and D′) have more pIGFR puncta (C and C′), as quantified in (E) (mean ± SEM, one-way ANOVA).
(F) Upregulated c-fos in pitpnc1a−/− embryos is reduced to wild-type by soaking in 1 ng/μL IGFBP2 from 36 to 48 hpf.
(G–J) ISH for c-fos in 6 dpf brains in constant dark after overnight exposure to PI3K (LY-294002, 2 μM) or Akt (MK-2206, 100 nM) inhibitors. (G and H) c-fos is upregulated in pitpnc1a−/− brains (G) relative to WT controls (H). (I and J) Akt (I) and PI3K (J) inhibitors reduce mutant c-fos expression to wild-type levels. Brains in (G)–(J) are overdeveloped to expose even weak c-fos expression.
(K) Exposure to 1 μM Akt inhibitor, MK-2206, reduces average night-time activity of 6 dpf pitpnc1a−/− larvae to wild-type levels. Each dot represents a single larva, and the crossbars plot the mean ± SEM (two-way ANOVA, genotype × drug interaction, Tukey’s post hoc test).
(L) Model of Pitpnc1a modulation of neuronal activity via IGFBP2 and inhibition of IGF-PI3K-Akt. Loss of Pitpnc1a enhances IGF signaling, leading to increased waking behavior.
(G–J) Ventral view; scale bars, 100 μm. (A–B′) Scale bars, 100 μm. (C–E′) Scale bars, 20 μm.