
Fig. 3
|
Fig. 3
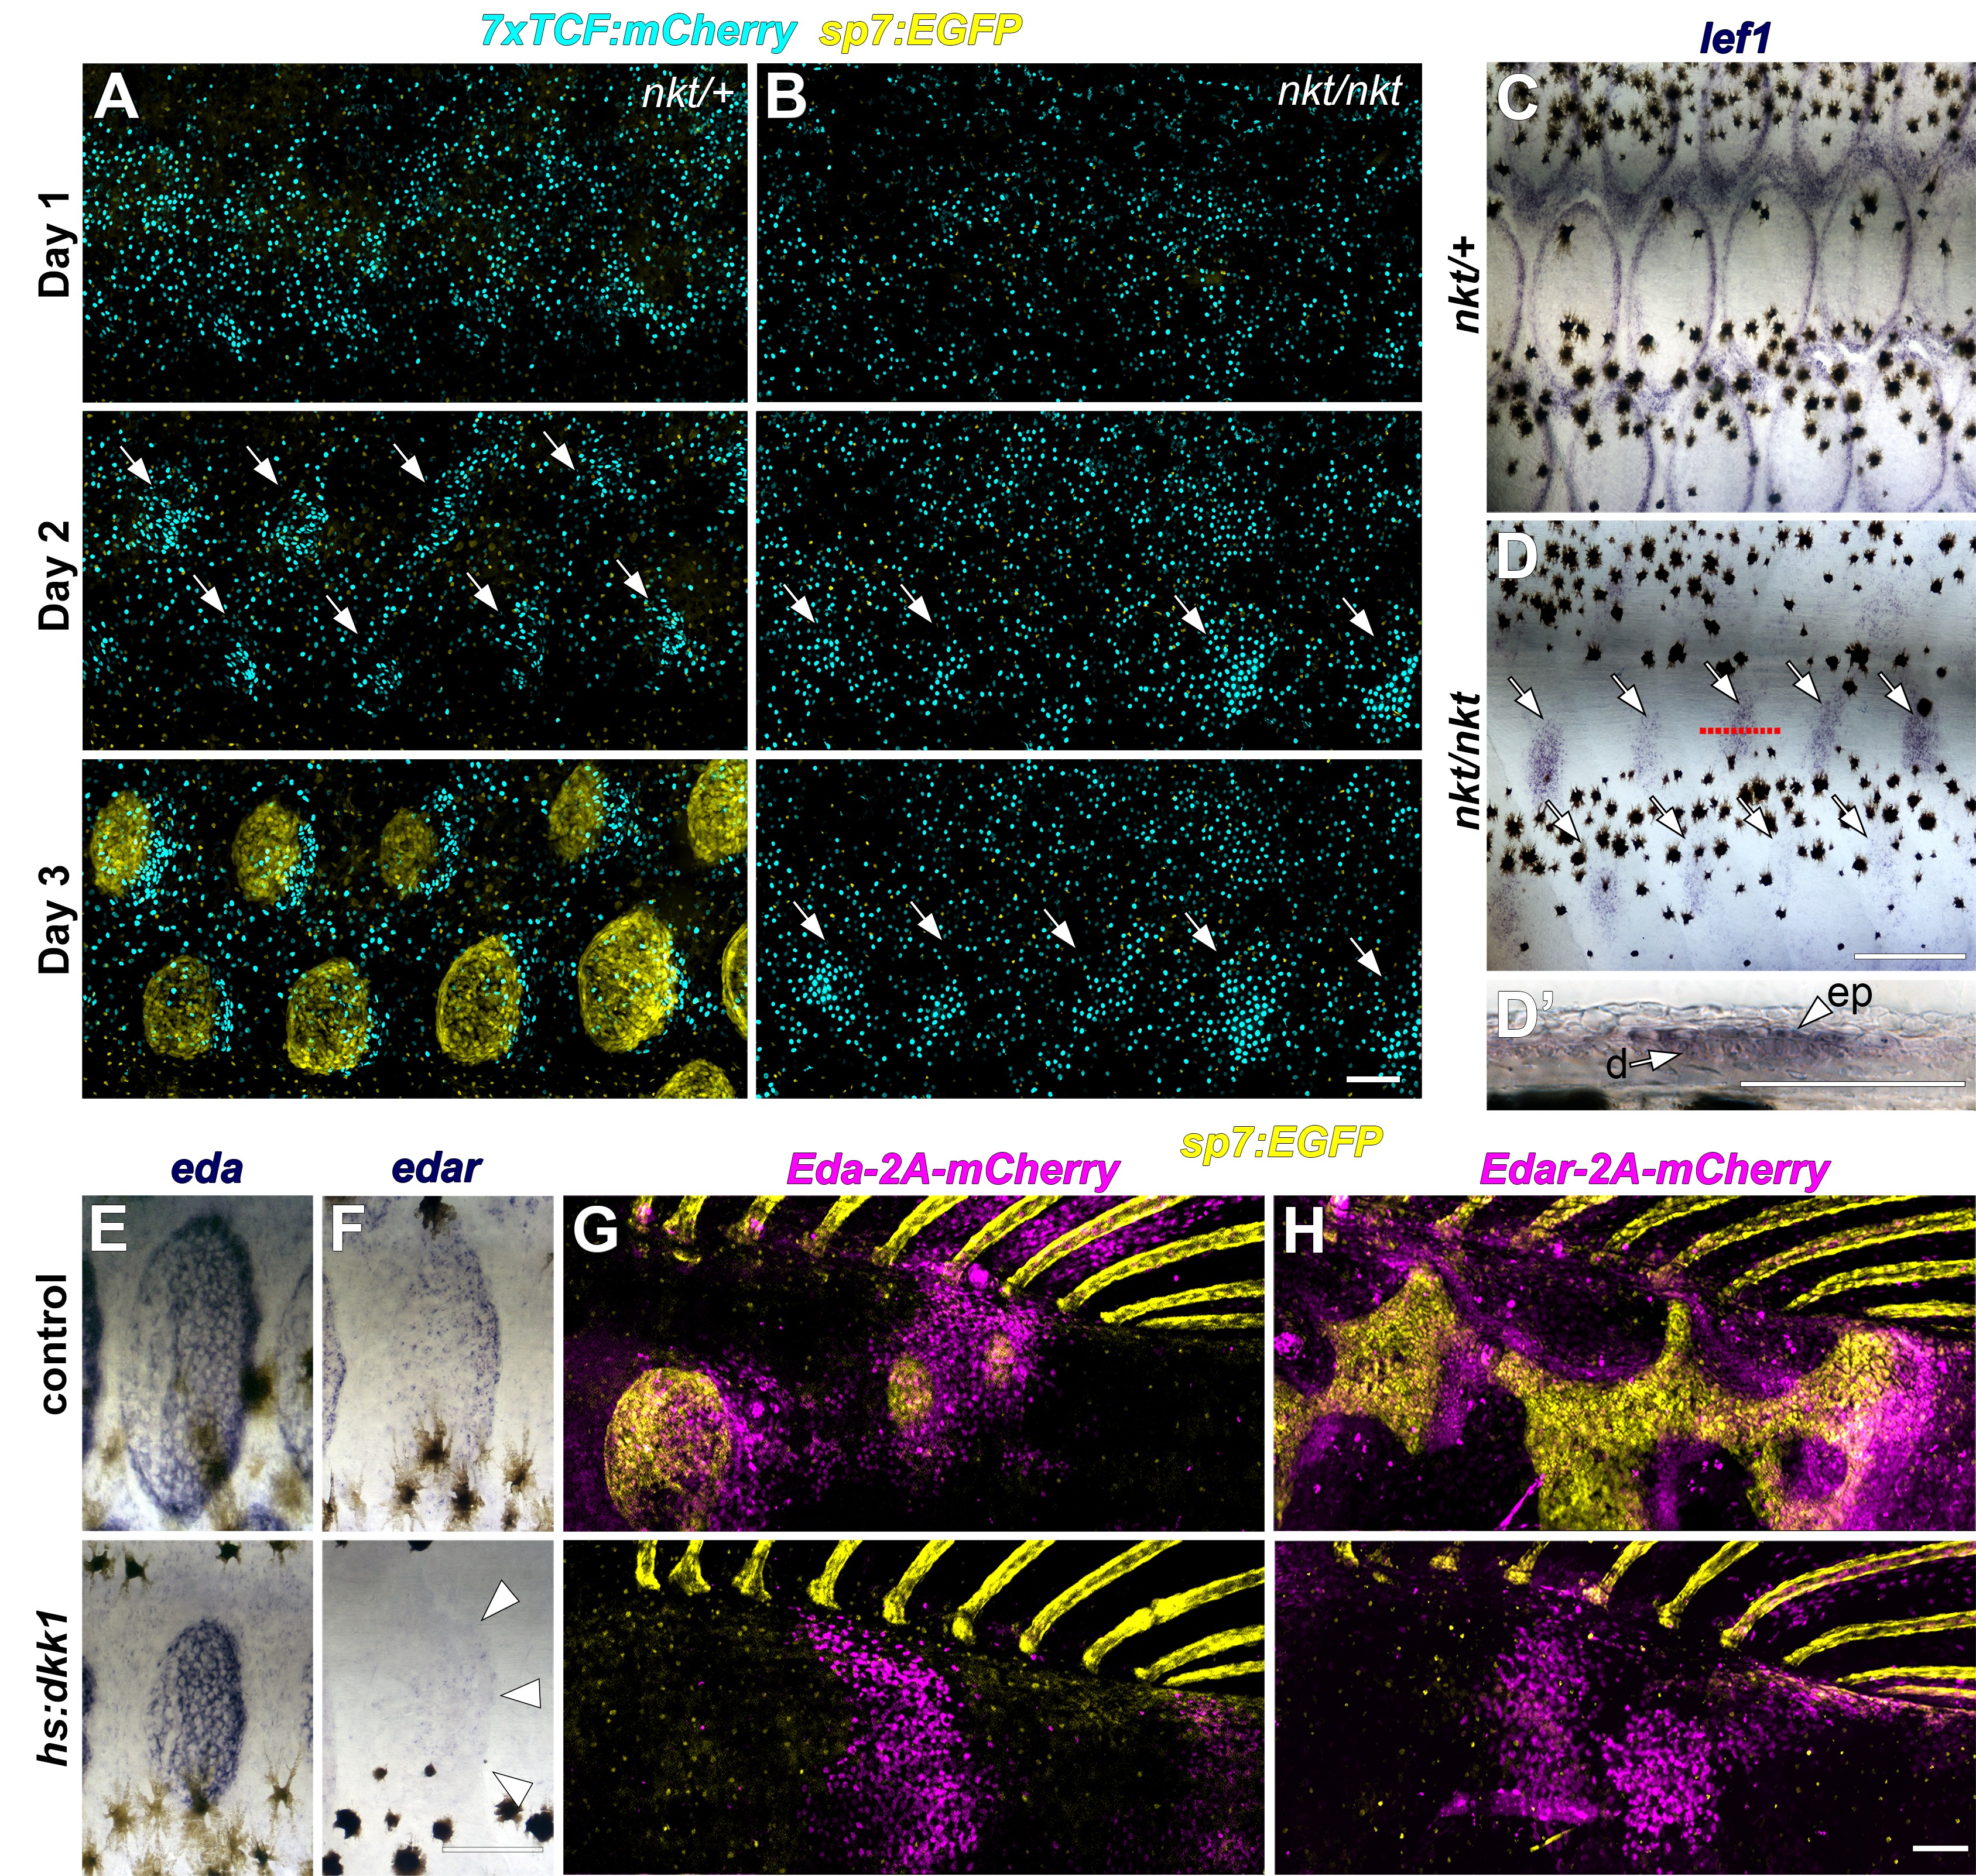
Wnt/β-catenin and Eda signaling interact during scale development.
(A) In WT (nkt/+) larvae, Wnt/β-catenin activity revealed by expression of 7x:TCF:mCherry (cyan), was patterned into a series of half-offset spots (arrows) prior to appearance of sp7:EGFP+ dSFCs (yellow, n = 6). (B) In Eda mutant (nkt/nkt) larvae, 7x:TCF:mCherry expression was patterned into spots (arrows), although no dSFCs developed (n = 6). (C) WT (nkt/+) fish fixed at 10.0–10.5 mm had multiple rows of lef1+ scales (n = 6). (D,D’) Scale-less Eda mutant (nkt/nkt) larvae of similar size had patterned expression of lef1 (arrows) in basal epidermal (ep) and dermal (d) cells (n = 4 of 6). (E) hs:dkk1 had no effect on eda expression in scales that developed prior to induction. (F) hs:dkk1 attenuated edar expression in scales (arrowheads indicate position of scale margin). (G,H) Expression of ectopic Eda and Edar (both magenta) caused ectopic scale formation in heat-shocked controls (top: Eda, n = 10; Edar, n = 20) but not hs:dkk1 larvae (bottom: Eda, n = 16; Edar n = 18). Scale bars, 100 µm (A, E–H); 50 µm (C, D, D’).