
|
Fig. 6
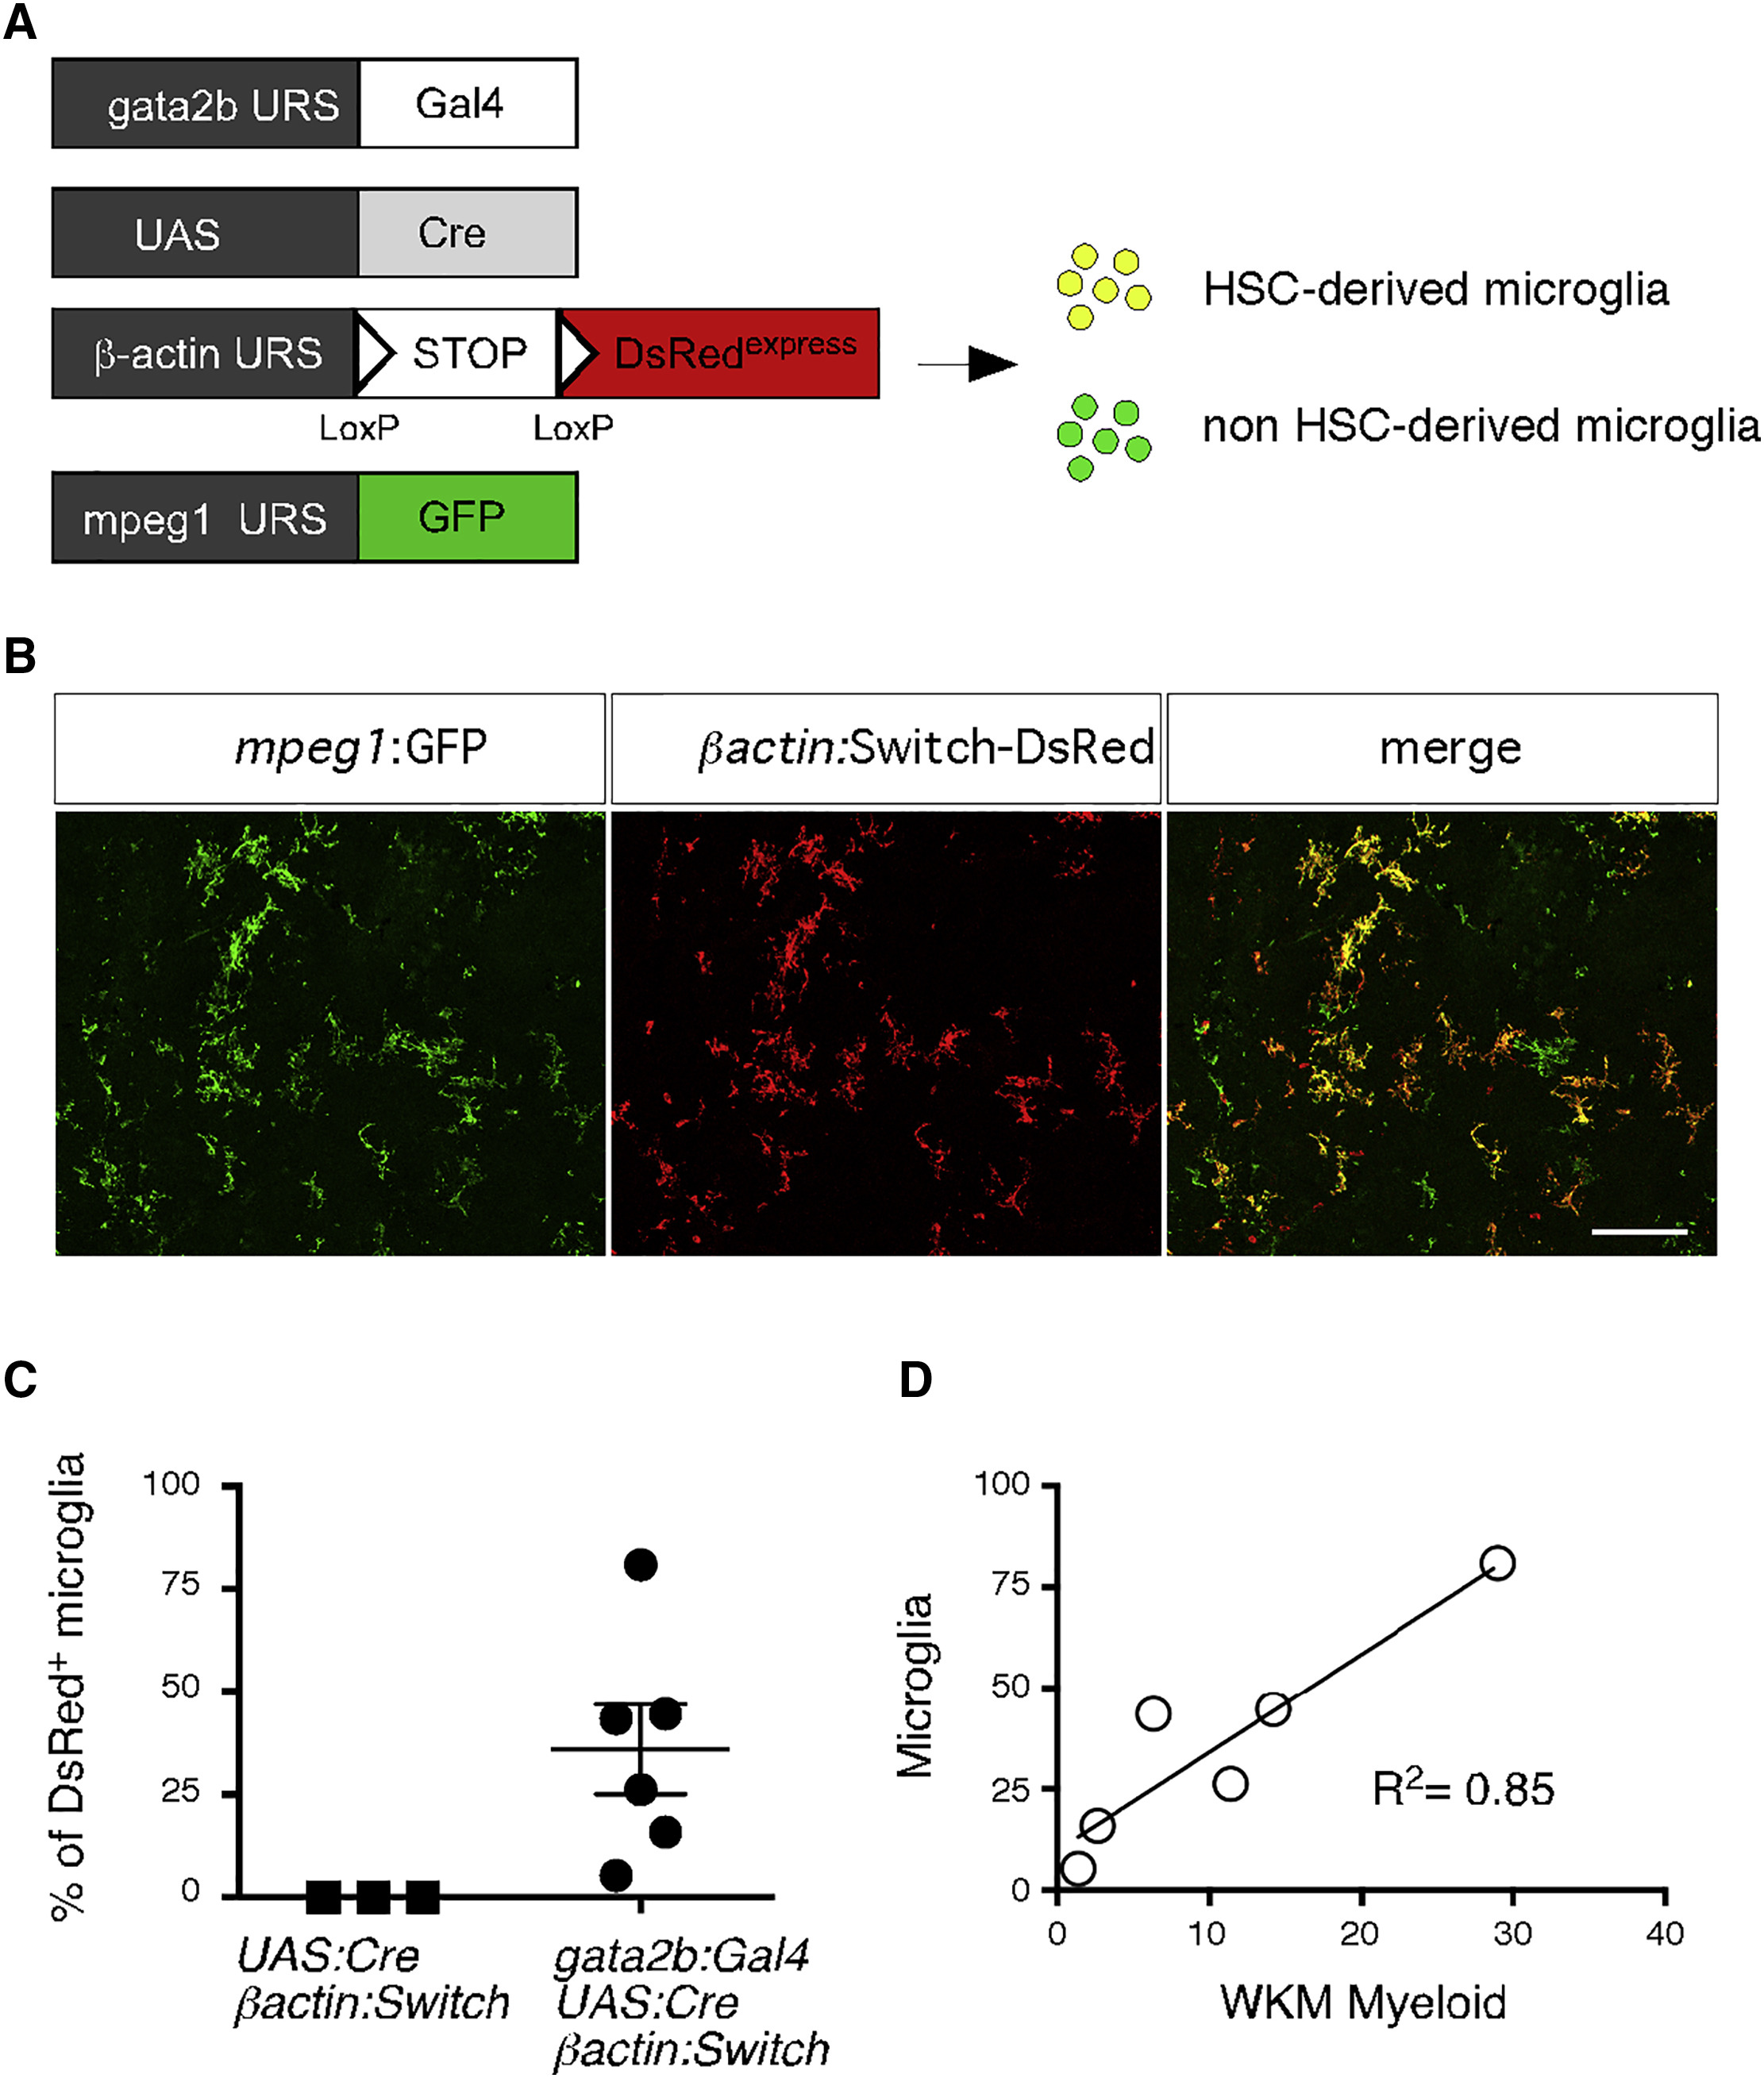
Adult MG Derive from Embryonic HSCs
(A) Transgenic lines used to address the MG potential of embryonic HSCs.
(B) GFP (left panel) and DsRed (middle panel) immunostaining performed on quadruple-transgenic adult brain sections. The right panel shows a merge of both fluorescent channels.
(C) Pooled data from two experiments showing the percent recombination among brain MG in control (left) and gata2b:Cre adult fish (right) (n = 6). Error bars represent mean ± SEM.
(D) Correlation and regression analysis (R2 = 0.85) between the chimerism in brain MG and the WKM myeloid fraction. MG, microglia; WKM, whole-kidney marrow.
See also Figure S6.