
IMAGE
Fig. S6
Image
|
Figure Caption
Fig. S6
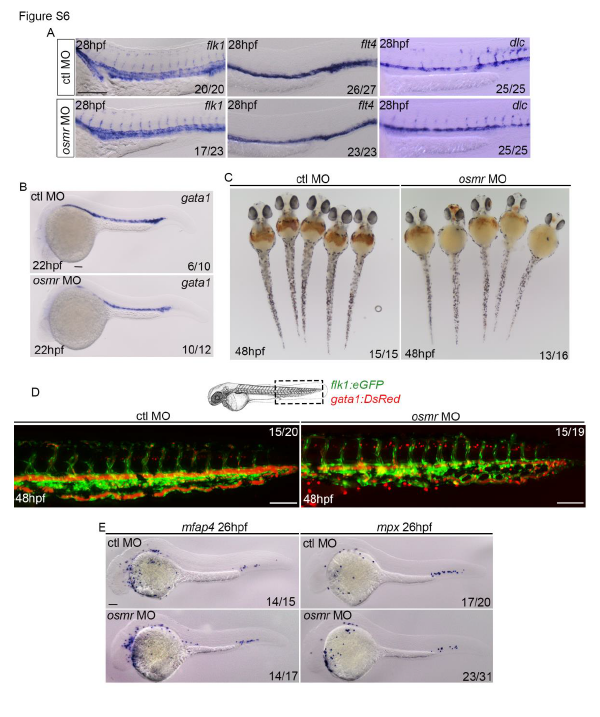
osmr morphants have reduced primitive erythropoiesis but normal primitive myelopoiesis.
(A) flk1, flt4 and dlc ISH expression at 28hpf in control or osmr morphants (B) gata1 ISH expression at 22hpf in control or osmr morphants. (C) O-dianisadine staining at 48hpf in control or osmr morphants. (D) Representative images of double transgenic flk1:eGFP/gata1:DsRed embryos injected with control or osmr morphants at 48hpf. (E) ISH analysis of macrophages (mfap expression) and neutrophils (mpx expression). All scale bars are 100μm.
Figure Data
Acknowledgments
This image is the copyrighted work of the attributed author or publisher, and
ZFIN has permission only to display this image to its users.
Additional permissions should be obtained from the applicable author or publisher of the image.
Full text @ Stem Cell Reports