
|
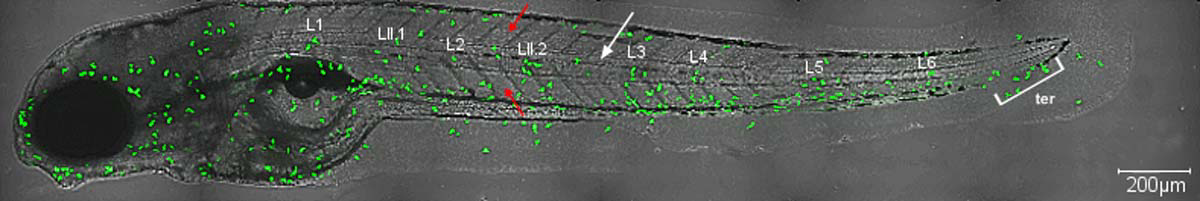
Fig. 1
A photograph illustrating the neutrophil counting area.
5 dpf Tg(MPX:GFP) transgenic zebrafish larvae after 40 min exposure to 10 µM CuSO4 presents the area were neutrophils were quantified (green dots; in the intact larvae only single neutrophils were observed). Both neutrophils associated with investigated neuromasts (L1, LII.1, L2, LII.2, L3, L4, L5 and L6) as well as those which did not adhere directly to the neuromasts (but were sparsely found within the area encircled by the notochord [white arrow]) were counted. Dorsal and ventral myotomes marked with red arrows and terminal neuromasts (ter) were excluded from the analysis. The larvae carried myeloperoxidase promoter driving the expression of green fluorescent protein (GFP) in myeloid leukocytes (mostly neutrophils). The visualization was accomplished using a Zeiss LSM-700 confocal microscope.