
Fig. 2
- ID
- ZDB-IMAGE-180801-12
- Genes
- Publication
- LLeras Forero et al., 2018 - Segmentation of the zebrafish axial skeleton relies on notochord sheath cells and not on the segmentation clock
- All Figures
- Figures for LLeras Forero et al., 2018
|
Fig. 2
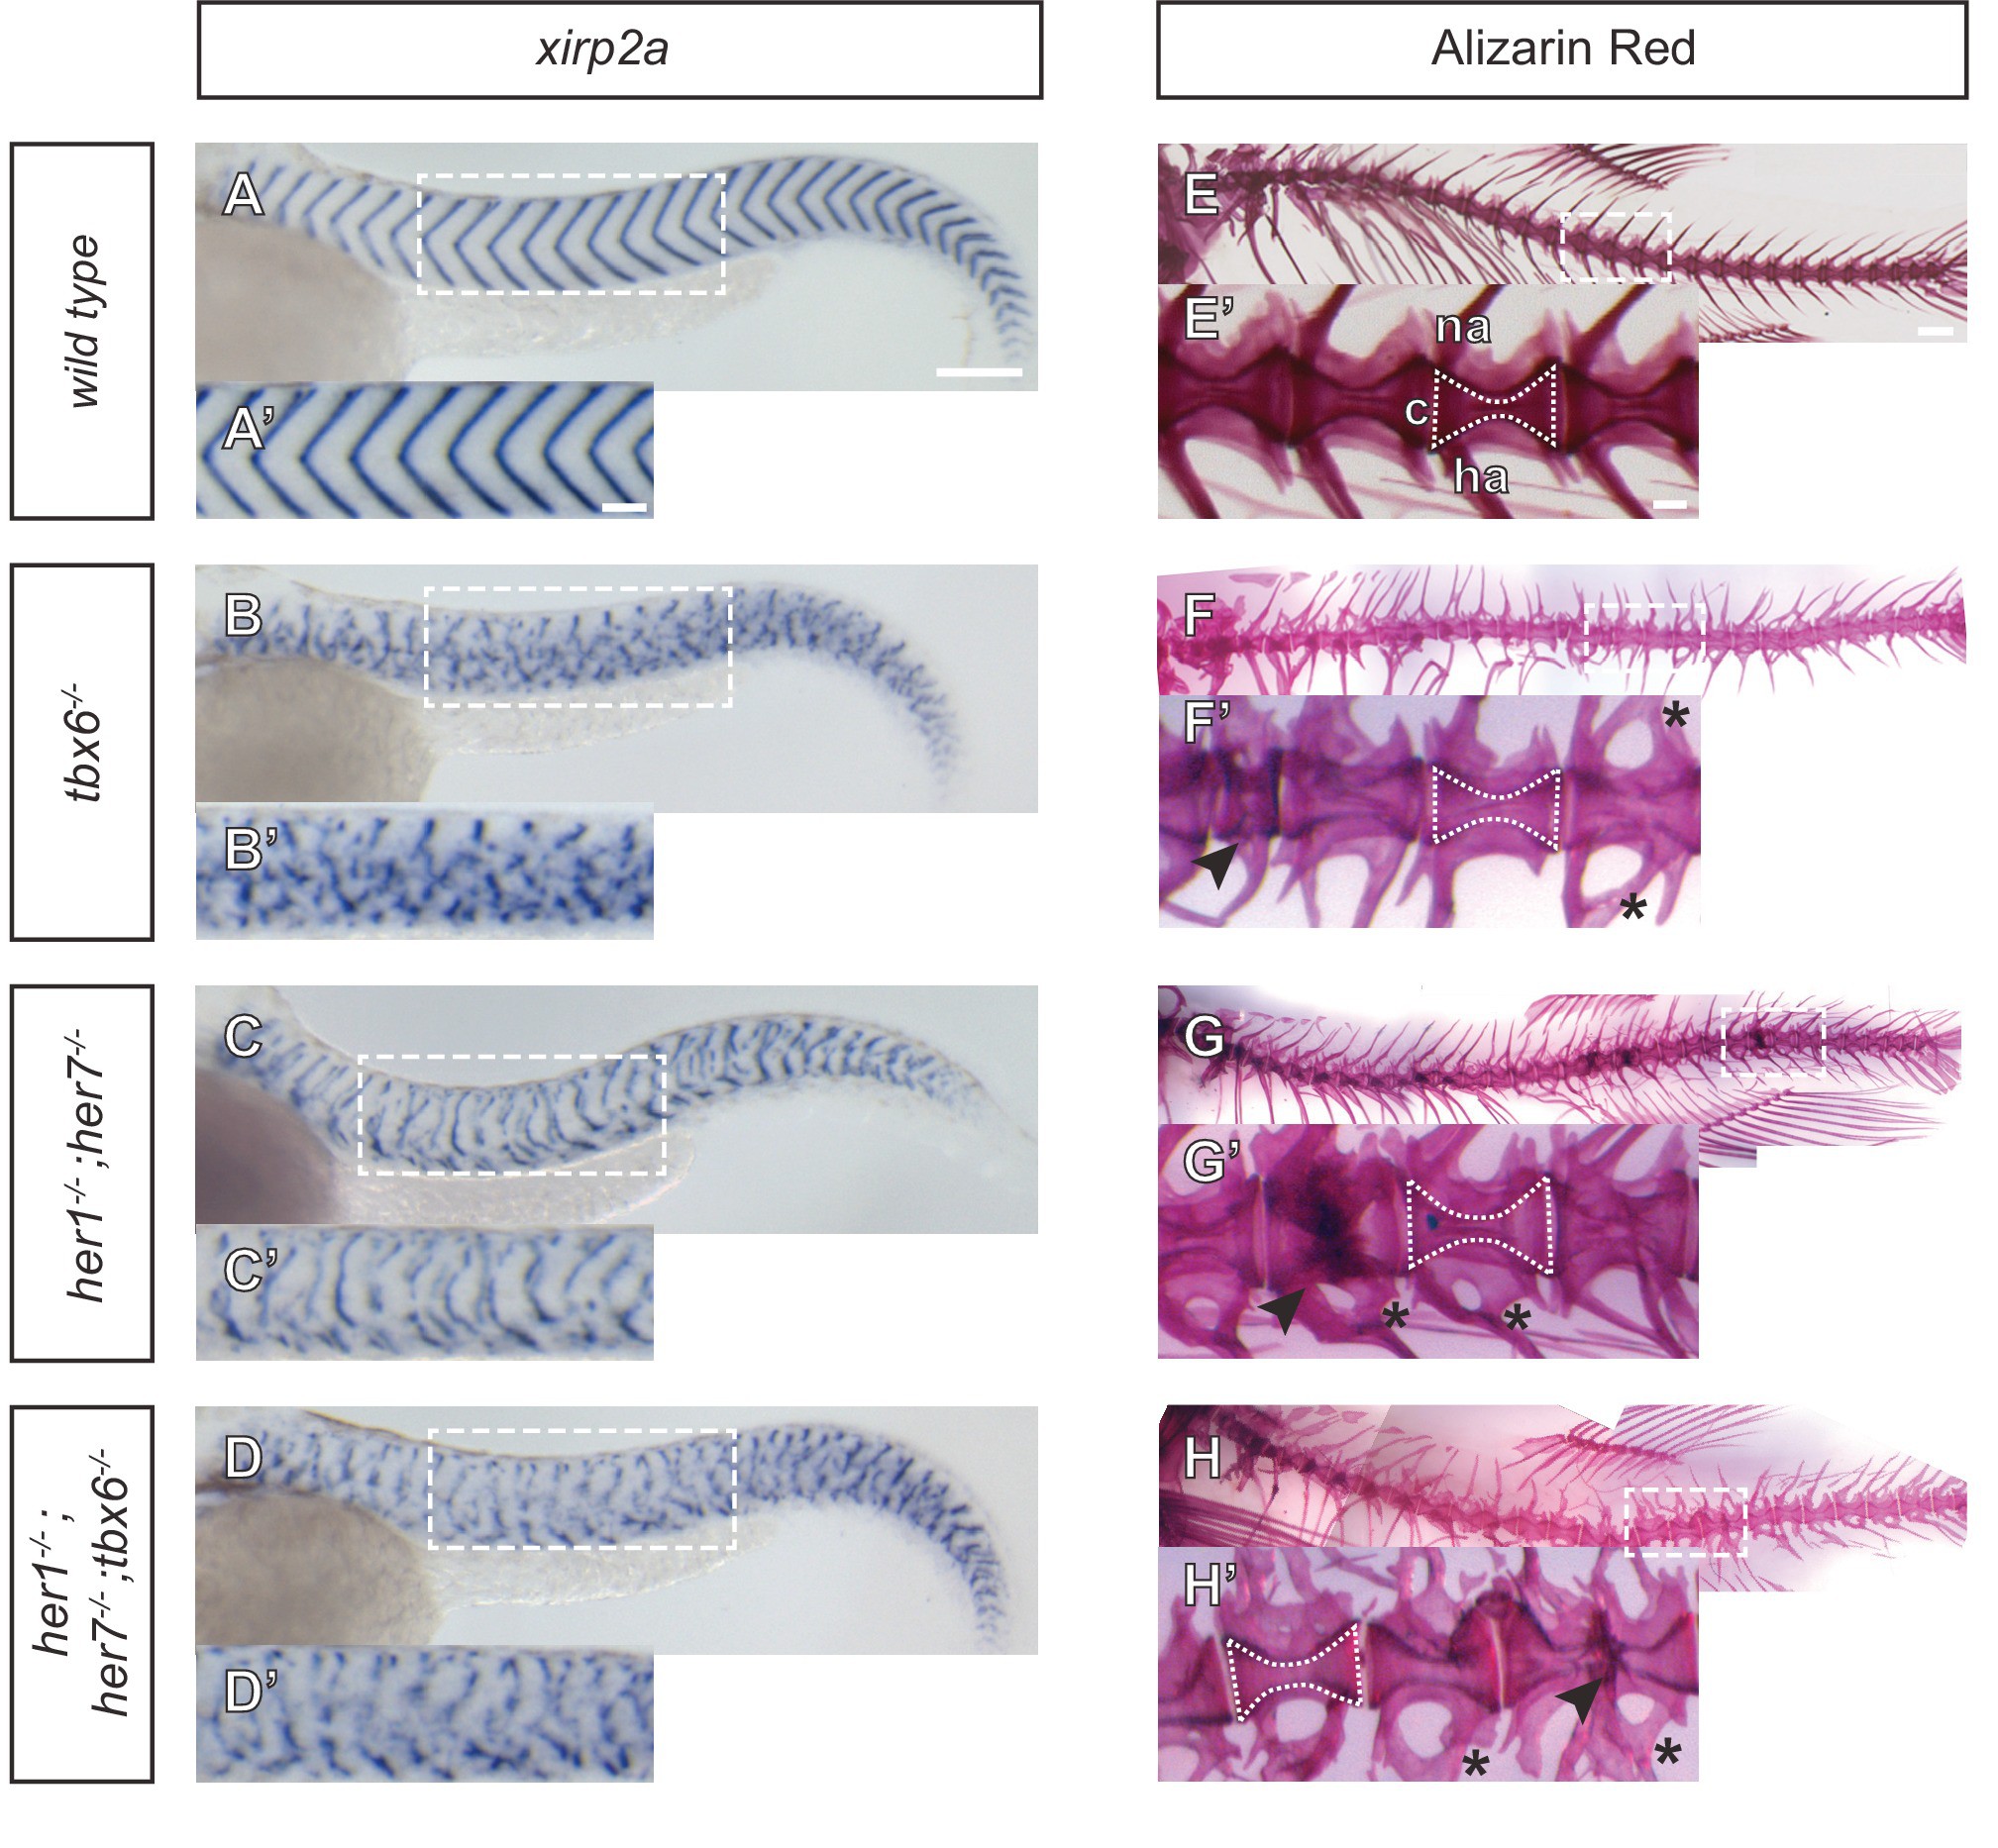
Myotome boundaries are disrupted in segmentation clock mutants, but chordacentra are still patterned.
(A to D’) In situ hybridization for myotome boundary marker xirp2a. Myotome boundaries are disrupted to differing degrees of severity depending on the genotype. (E–H’) Alizarin Red bone preparations. Centra are well-formed in tbx6−/− (n = 10) (F), while neural and hemal arches are often fused (F´). Centra are also well-formed in her1−/−;her7−/− (n = 14) (G,G’) and her1−/−;her7−/−;tbx6−/− (n = 15) (H,H’). Occasional defects occur, seen as smaller vertebrae (arrowhead in F’), or as fusions of two vertebrae (arrowheads in G’ and H’). Larvae in A-D are 40 hpf. Adult fish in E-H are between two and six months. All animals in lateral view with anterior to the left. na - neural arch, hr - hemal arch, c - centrum. Scale bars in A and A’ are 150 µm and 100 µm respectively and apply to A-D and A’-D’ respectively. Scale bar in E is 1 mm and applies to E-H, scale bar in E’ is 200 µm and applies to E’-H’. Asterisks highlight fused neural and hemal arches.