
Fig. S3
|
Fig. S3
Phenotype and Rescue of cep128 Morphants. Related to Figure 2,
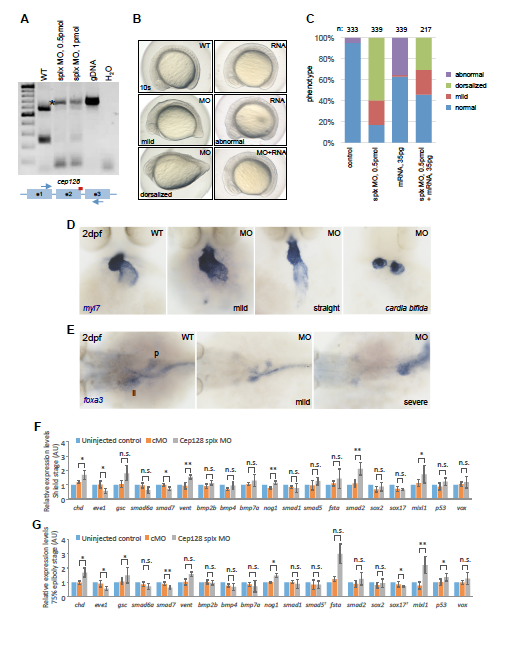
(A) Analysis of the cep128 splx MO efficiency shows that splicing is mostly abnormal in morphants. Note the additional detected PCR product caused by alternative splicing, and inclusion of the intron (asterisk), which is also caused by the MO. Positions of the MO (red bar) and the primers (arrows) on cep128 are illustrated.
(B) The dorsalized phenotype of cep128 morphants is partly rescued by injection of cep128 mRNA (right, bottom). In one third of embryos, overexpression of mRNA alone leads to an abnormal phenotype with mild to moderate defects at brain and trunk region (right, middle), which differs from the dorsalized phenotype observed with the injection of the MO (left, bottom). Left panels are taken from Figure 2A, to help with the comparison of the phenotypes. (C) Quantification of phenotypic analysis.
(D) In situ hybridization with a probe against myl7 shows different defects in heart development in surviving embryos (0.25pmol MO injected) at 2 dpf, leading from a mild phenotype to few cases of cardia bifida.
(E) Liver (li) and pancreas (p) development are affected by cep128 depletion (0.25 pmol) in embryos surviving to 2 dpf, as seen by foxa3 expression.
(F-G) Expression levels of dorsal (gsc), ventral (eve1, vent, vox) markers and Tgf-β (smad6a, smad7, smad2, mixl1, p53) and Bmp (chd, bmp2b, bmp4, bmp7a, nog1, smad1, smad5, fsta, sox2, sox17) pathway members in cep128 splx morphants (0.5 pmol) at shield and 75% epiboly stages. * P<0.05, ** P<0.01 (one way ANOVA analysis), n>=3 independent experiments.