
|
Fig. S2
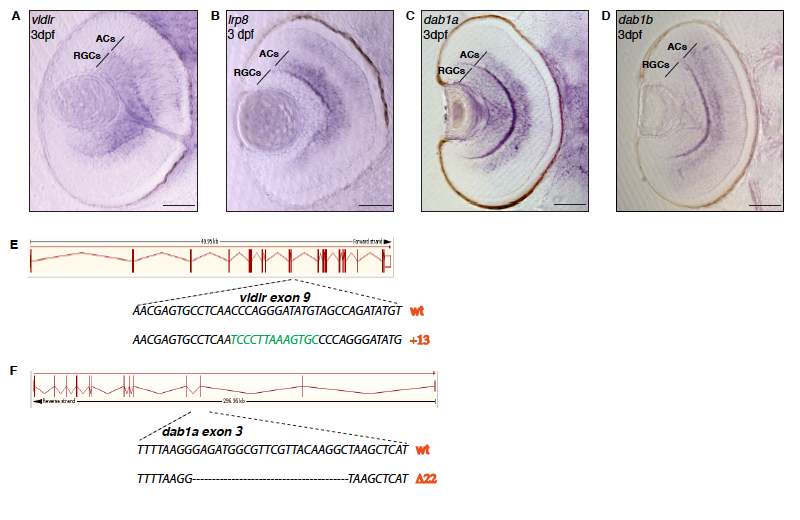
Expression patterns and gene disruption of Reelin signaling pathway members. Related to Figure 1.
(A) Cross-section of a 3 dpf zebrafish retina showing mRNA expression of the Reelin receptor vldlr in RGC and amacrine cell (AC) populations. Scale bar = 40 μm.
(B) Cross-section of a 3 dpf zebrafish retina showing mRNA expression of the Reelin receptor lrp8 in amacrine cells but not in RGCs. Scale bar = 40μm.
(C) Cross-section of a 3 dpf zebrafish retina showing mRNA expression of an intracellular transducer downstream of vldlr, dab1a, in RGCs and ACs. Scale bar = 40 μm.
(D) Cross-section of a 3 dpf zebrafish retina showing mRNA expression of the dab1aparalog dab1b in amacrine cells but not in RGCs. Scale bar = 40μm.
(E) Schematics of CRISPR/Cas9-mediated gene disruption at the vldlr genomic locus. The targeting of the gene induced an insertion of 13 bp in the vldlr gene leading to the generation of a premature STOP codon as described in Supplemental Table S1.
(F) Schematics of CRISPR/Cas9-mediated gene disruption at the dab1a genomic locus. The targeting of the gene induced a deletion of 22 bp in the dab1a gene leading to complete rearrangement of the genomic sequence as described in Supplemental Table S1.