
|
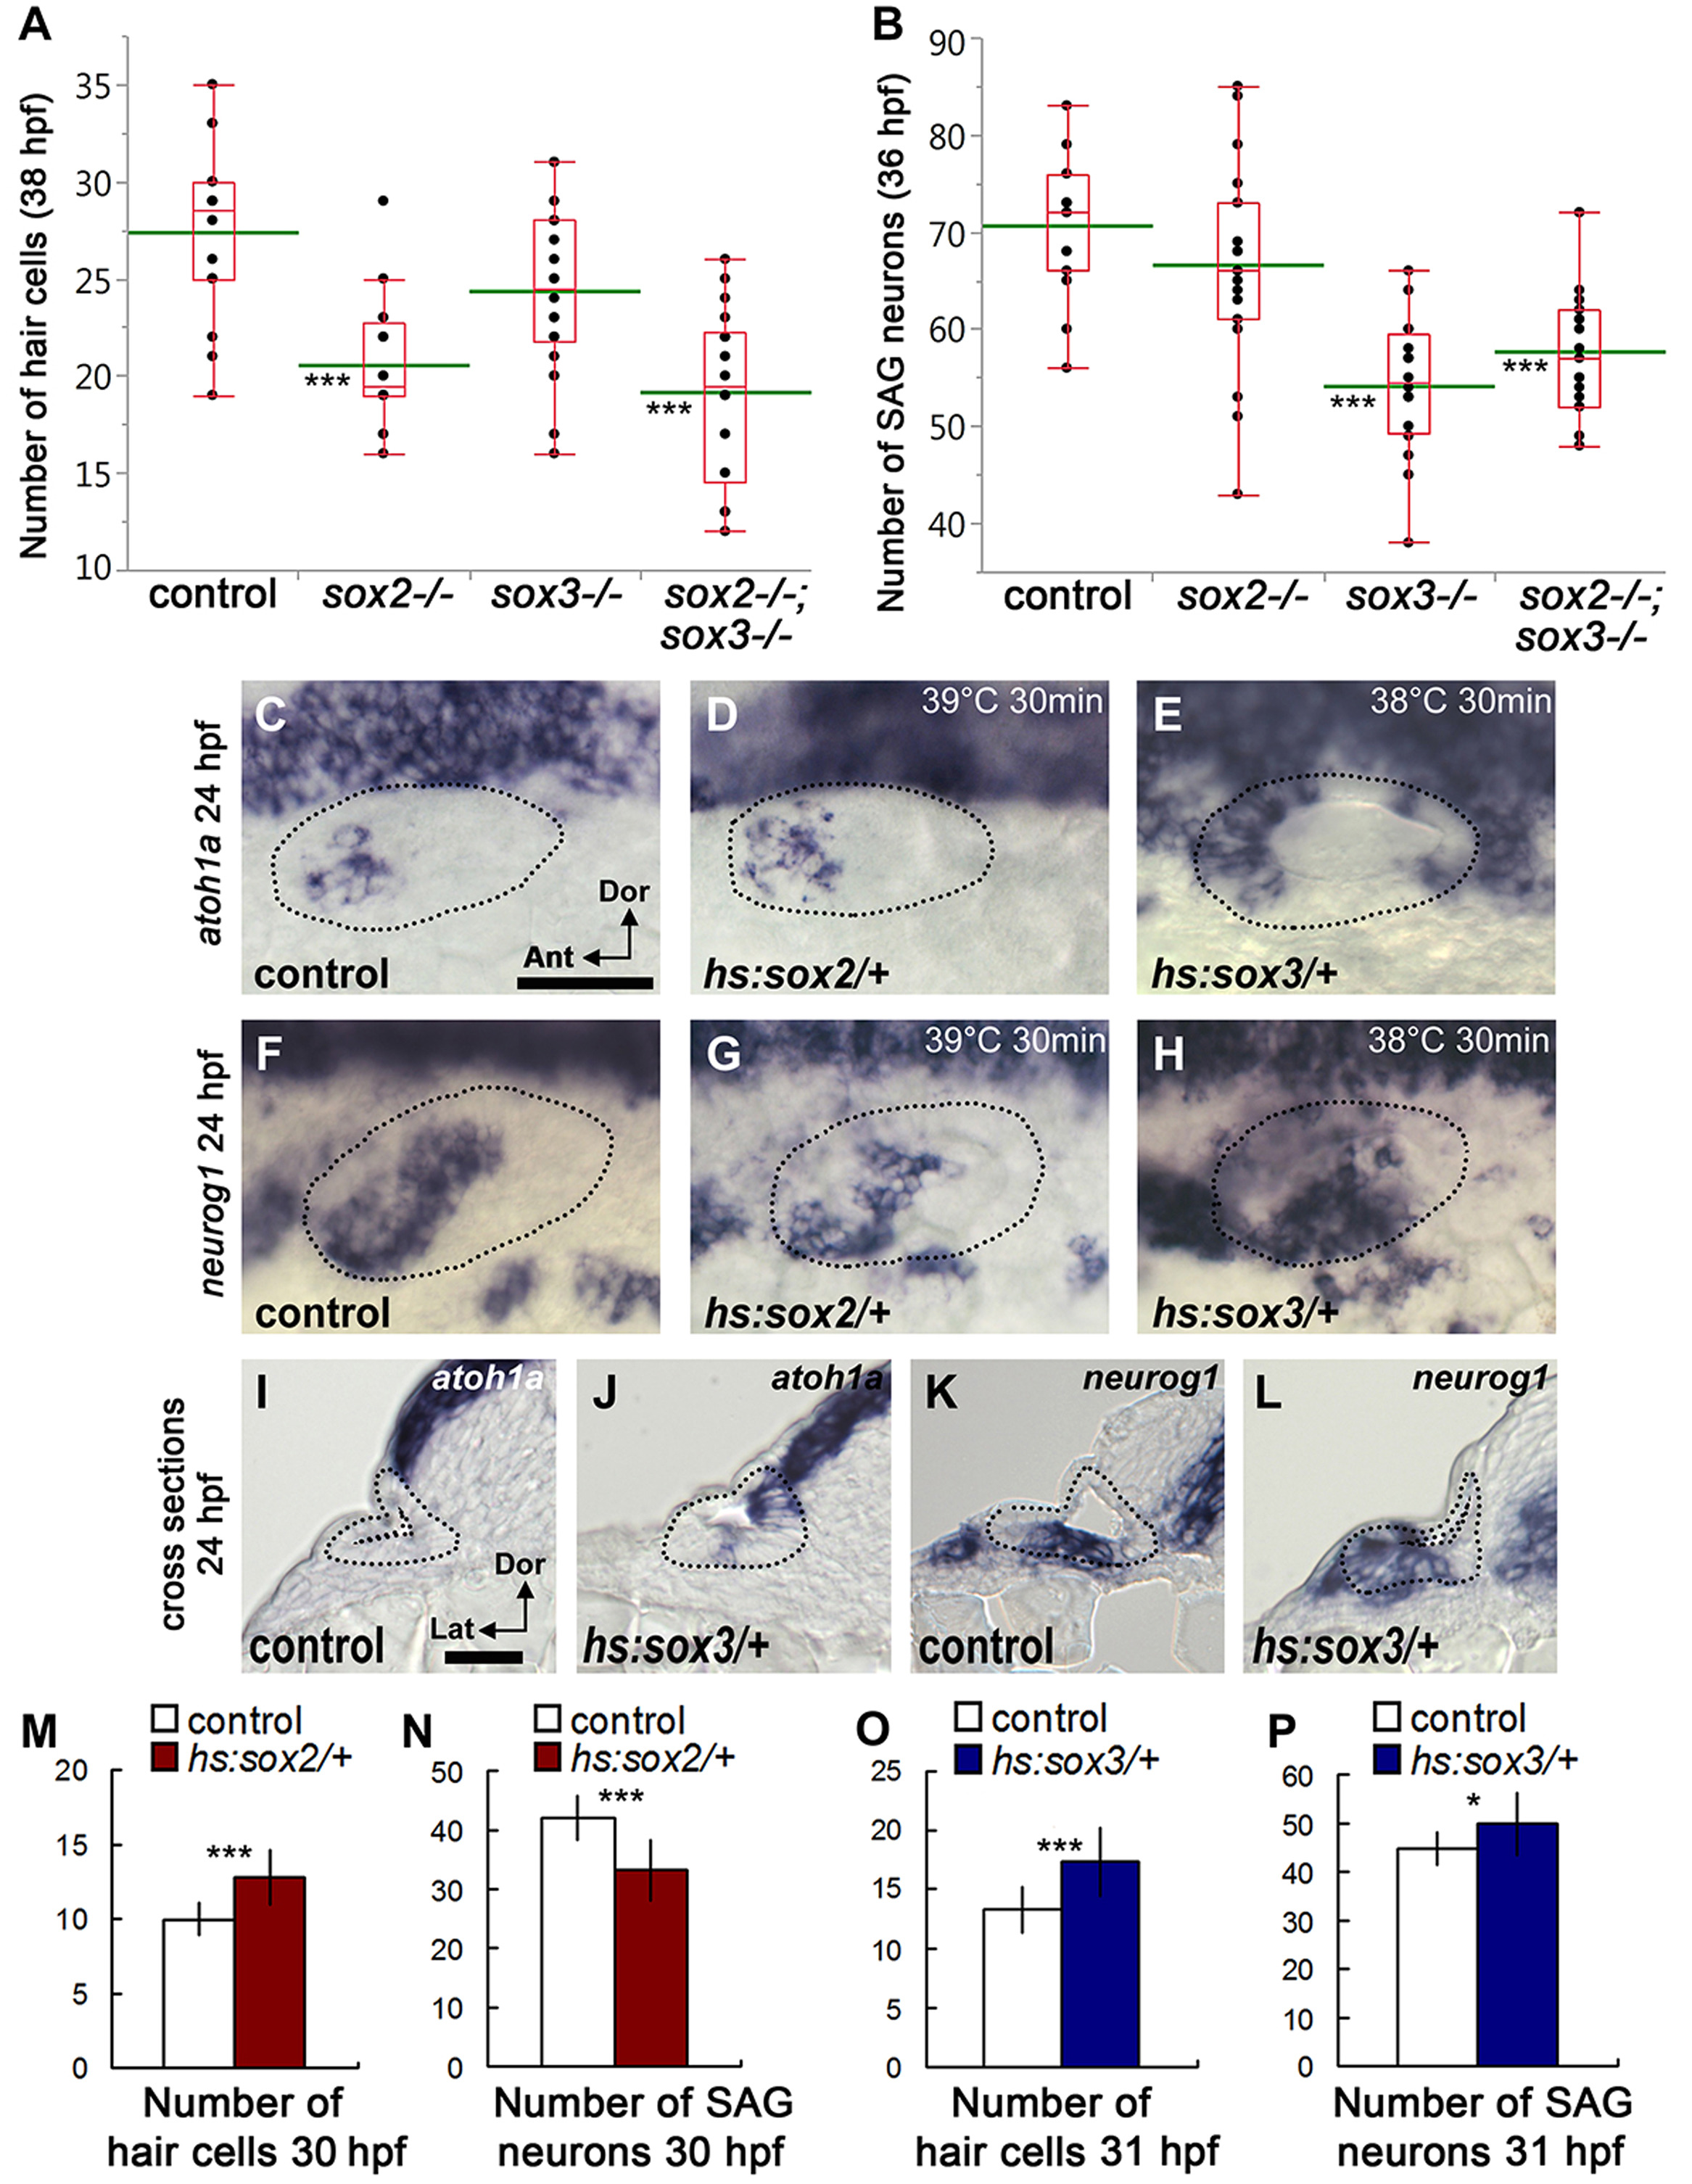
Fig. 2
Distinct roles forsox2andsox3in sensory and neural development. (A, B) Box-and-whisker plots of the total number of hair cells at 38 hpf (A) and mature SAG neurons at 36 hpf (B) in control, sox2-/-, sox3-/- and sox2-/-; sox3-/- double mutant embryos. Green lines represent means. Asterisks indicate statistically significant differences compared to controls (***P<0.001, Tukey's HSD test following ANOVA). (C–H) Dorsolateral views (anterior to left) of expression of atoh1a (C–E) and neurog1 (F–H) at 24 hpf in control embryos, hs:sox2/+ heterozygotes and hs:sox3/+ heterozygotes. Embryos were heat shocked at 12.5 hpf, 38 °C or 39 °C for 30 min, as indicated. (I–L) Expression of atoh1a (I, J) and neurog1 (K, L) at 24 hpf in cross sections through the middle of the otic vesicle in control embryos (I, K) and hs:sox3/+ heterozygotes (J, L). Embryos were heat shocked at 12.5 hpf, 38 °C for 30 min. Otic vesicle borders are outlined in C–L. (M, N) Quantification of the total number of hair cells (M) and mature SAG neurons (N) at 30 hpf in control and hs:sox2/+ embryos. (O, P) Quantification of the total number of hair cells (O) and mature SAG neurons (P) at 31 hpf in control and hs:sox3/+ embryos. Error bars represent standard deviation in M–P, and asterisks indicate statistically significant differences relative to controls (*P<0.05, ***P<0.001, student's t-test, n>13).
Reprinted from Developmental Biology, 435(1), Gou, Y., Vemaraju, S., Sweet, E.M., Kwon, H.J., Riley, B.B., sox2 and sox3 play unique roles in development of hair cells and neurons in the zebrafish inner ear, 73-83, Copyright (2018) with permission from Elsevier. Full text @ Dev. Biol.