
|
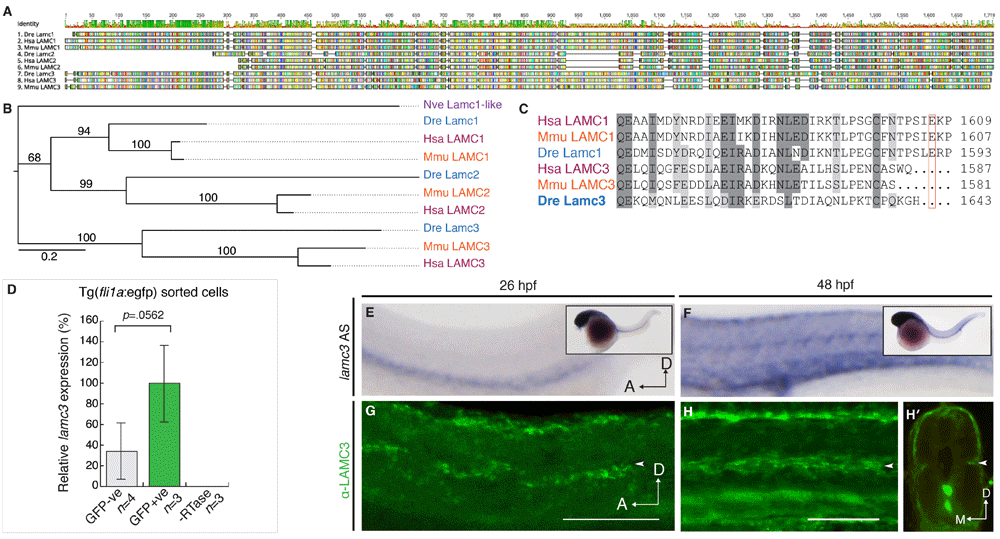
Fig. 1
Lamc3 expression during zebrafish development.
(A) MUSCLE-aligned protein “fingerprints” of zebrafish (Danio rerio, Dre), human (Homo sapiens, Hsa), and mouse (Mus musculus, Mmu) LAMC1, LAMC2, and LAMC3 amino acid sequences with RasMol colouring. (B) Unrooted RaxML phylogenetic tree (JTT+Gamma model) of Nematostella vectensis (purple, Nve) Lamc1-like and human (red, Hsa), mouse (orange, Mmu), and zebrafish (blue, Dre) LAMC1, LAMC2, and LAMC3 proteins. Branch labels denote ML bootstrap values (100). (C) Aligned human, mouse, and zebrafish amino acid sequence of the laminin γ1 and γ3 C-terminal tails show that the loss of the essential glutamic acid residue in γ3 is conserved across vertebrates. (D) qRT-PCR shows lamc3 is not significantly enriched in gfp+ endothelial cells (1.85E-05±5.49E-06, n=3) compared to GFP- cells (6.28E-06±1.48E-06, n=4) sorted from 26 hpf Tg(fli1a:egfp) embryos. Expression is relative to ef1α expression and normalised to GFP+ population (100%). All val