
Fig. 4
|
Fig. 4
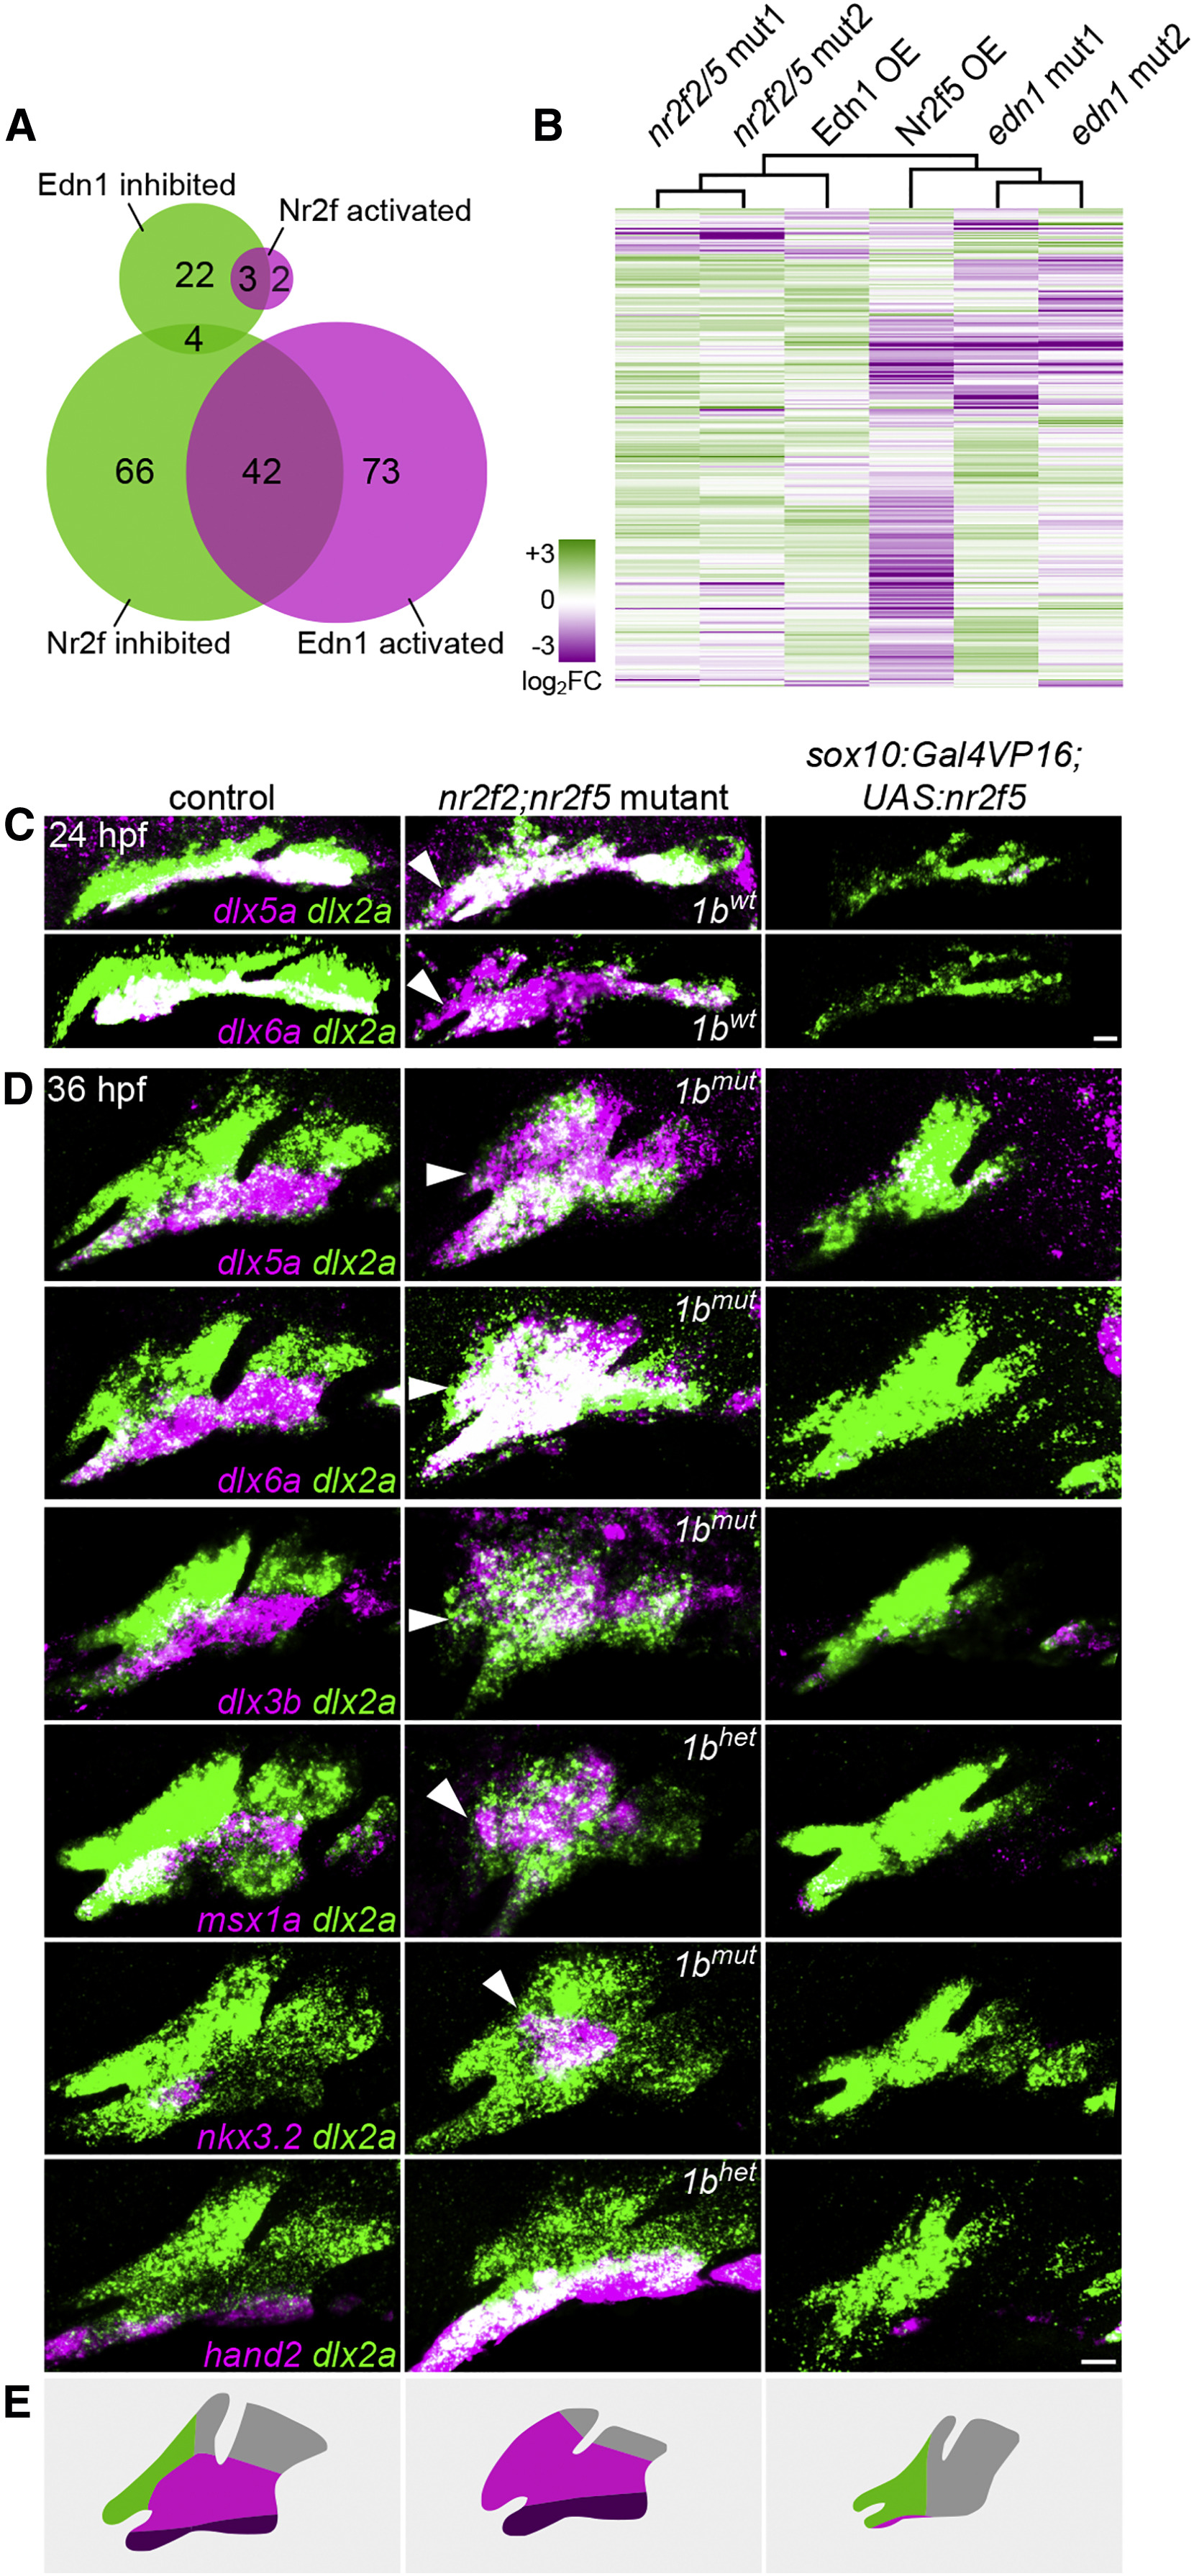
Nr2f2/5 Broadly Inhibit Mandibular Gene Expression
(A) Venn diagrams depicting the overlap between genes inhibited and activated by Nr2fs and Edn1.
(B) Hierarchical clustering of log2 fold-change values relative to controls for 350 arch-enriched genes in nr2f2; nr2f5 mutants, sox10:Gal4VP16; UAS:Nr2f5 transgenics (Nr2f5 OE), edn1 mutants, and hsp70l:Gal4; UAS:Edn1 (Edn1 OE) transgenics. Reference data are from Askary et al. (2017). See Table S1 for transcripts per million (TPM) values of all arch-enriched genes.
(C and D) Fluorescence in situ images for dysregulated genes (magenta) relative to all arch NCCs (dlx2a+, green) in nr2f2; nr2f5 mutants (nr2f1b genotype indicated) and sox10:Gal4VP16; UAS:Nr2f5 transgenics at 24 (C) or 36 hpf (D). Arrowheads indicate ectopic maxillary expression. Images are representative maximum-intensity projections. Scale bars, 20 μm.
(E) Schematized shifts in arch gene expression territories. See Figure S4 for expression patterns of non-mandibular genes.
Reprinted from Developmental Cell, 44(3), Barske, L., Rataud, P., Behizad, K., Del Rio, L., Cox, S.G., Crump, J.G., Essential Role of Nr2f Nuclear Receptors in Patterning the Vertebrate Upper Jaw, 337-347.e5, Copyright (2018) with permission from Elsevier. Full text @ Dev. Cell