
|
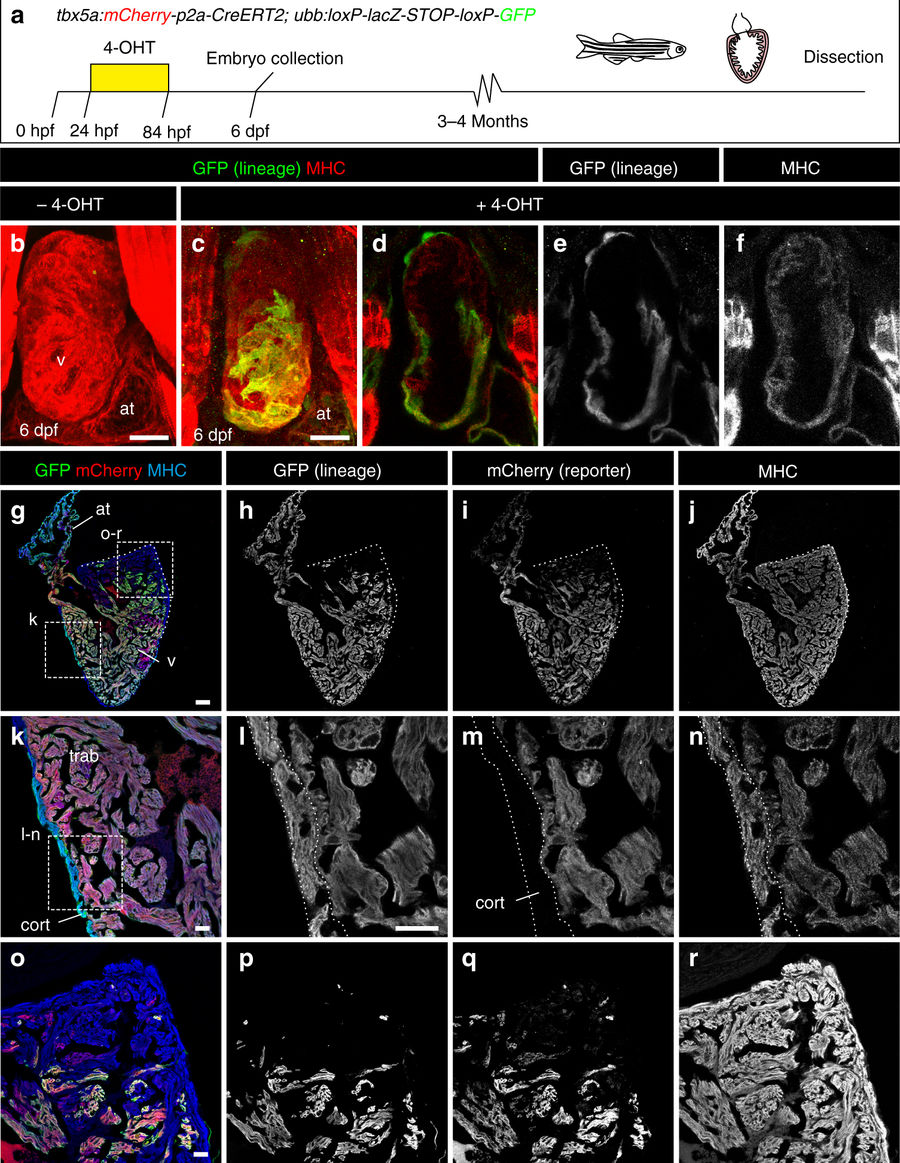
Fig. 3
Fate mapping of tbx5a-derived cells during cardiac development. a tbx5a:mCherry-p2A-CreERT2;ubb:loxP-LacZ-STOP-loxP-GFP hearts fixed at different developmental stages. mCherry marks tbx5a-expressing cells; GFP marks tbx5a-derived cells. b–f Whole-mount ventral view of hearts at 6 days postfertilisation (dpf) stained for GFP (green) and Myosin Heavy Chain (MHC, red). b In the absence of 4- Hydroxytamoxifen (4-OHT) administration, no GFP+ cells are visible (n = 5/5). c–f 4-OHT was added from 24 to 84 hours postfertilisation (hpf). GFP expression is observed in the proximal part of the ventricle; n = 8/8. In some cases, GFP expression was also found in epicardial cells located in the distal part of the ventricle. g–r Immunofluorescence staining of adult heart sections recombined as in c. Shown are merged and single channels for GFP (green), mCherry (red), and anti-MHC staining (blue); n = 5/5. at, atrium; cort, cortical layer; trab, trabecular layer; v, ventricle. Scale bars, g 100 μm and b, c, k, l, o 25 μm