
|
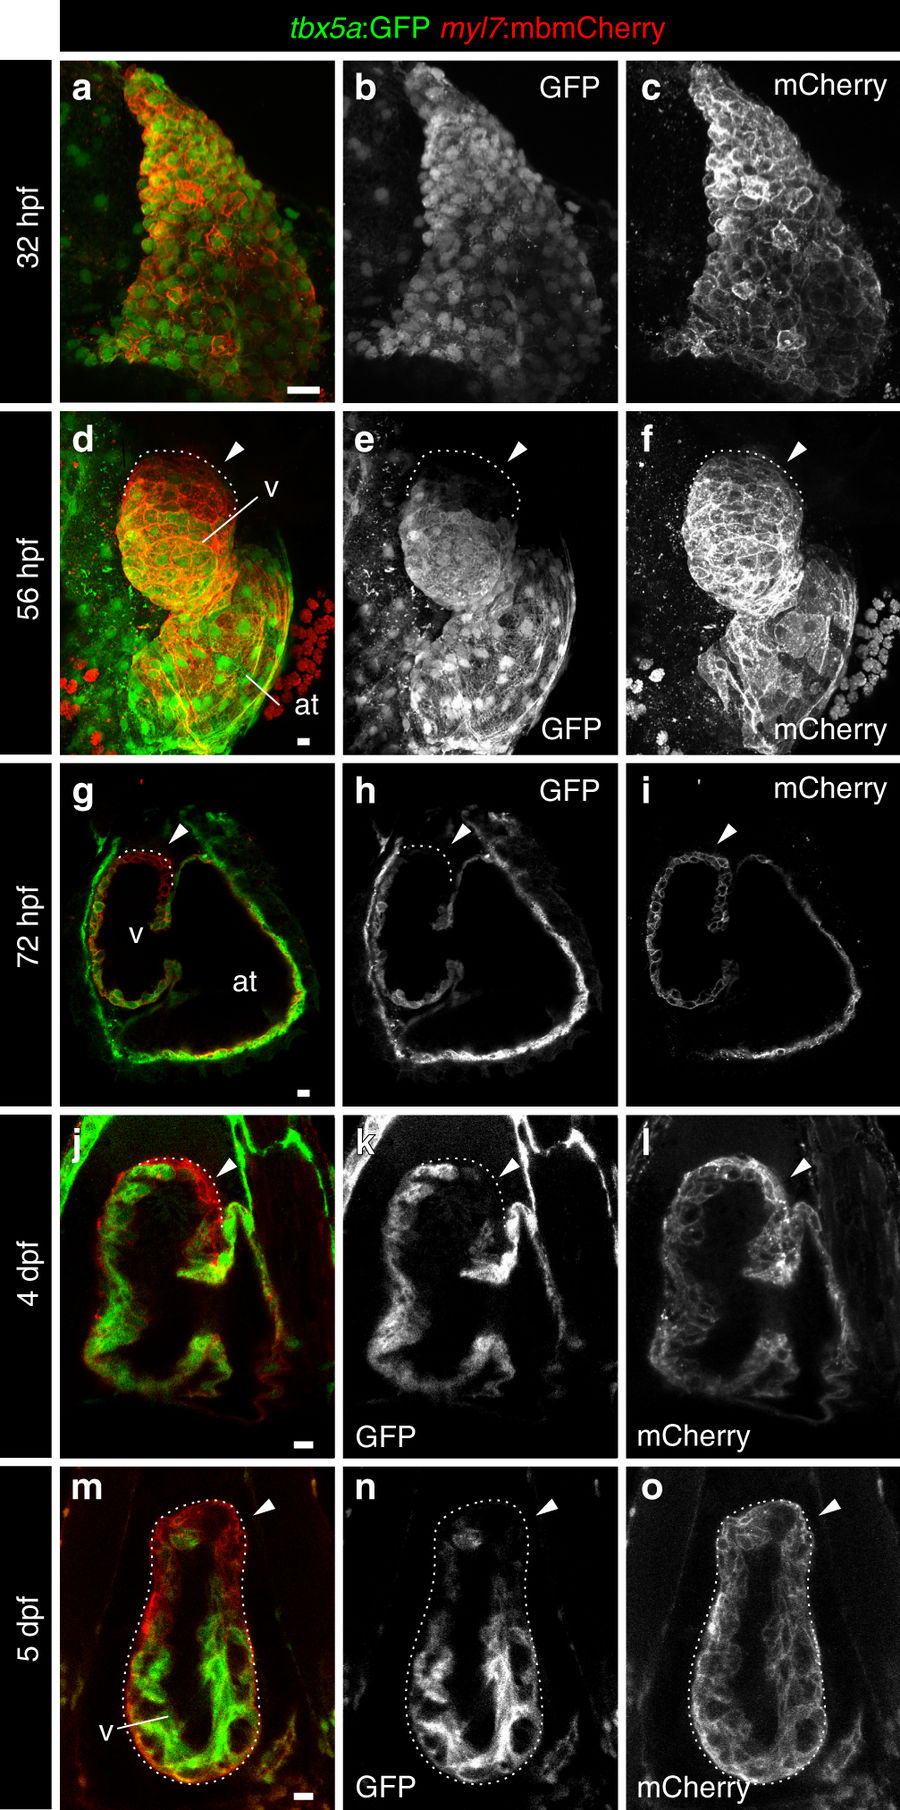
Fig. 1
Expression profile of tbx5a-positive cardiomyocytes in embryonic zebrafish hearts. a–f Whole-mount immunofluorescence of tbx5a:GFP;myl7:mbmCherry double transgenic zebrafish hearts at 32 a–c (n = 5/5) and 56 hours postfertilisation (hpf) d–f (n = 3/3). g–l Confocal optical sections of tbx5a:GFP;myl7:mbmCherry hearts at 72 hpf g–i (n = 5/5), 4 days postfertilisation (dpf) j–l (n = 9/9), and 5 dpf (m–o; n = 6/6). GFP (green) labels tbx5a+ cells and mCherry (red) marks cells expressing the pan-myocardial marker myosin light chain 7 (myl7). Shown are ventral views, cranial is to the top. At 32 hpf all cardiomyocytes are tbx5a:GFP+ but at 56, 72 hpf, 4, and 5 dpf tbx5a:GFP− cardiomyocytes can be observed in the distal ventricle (arrowheads). The atrioventricular canal and large portions of the atrium are also GFP+. at, atrium; v, ventricle; Scale bars, 10 μm