
Fig. 5
|
Fig. 5
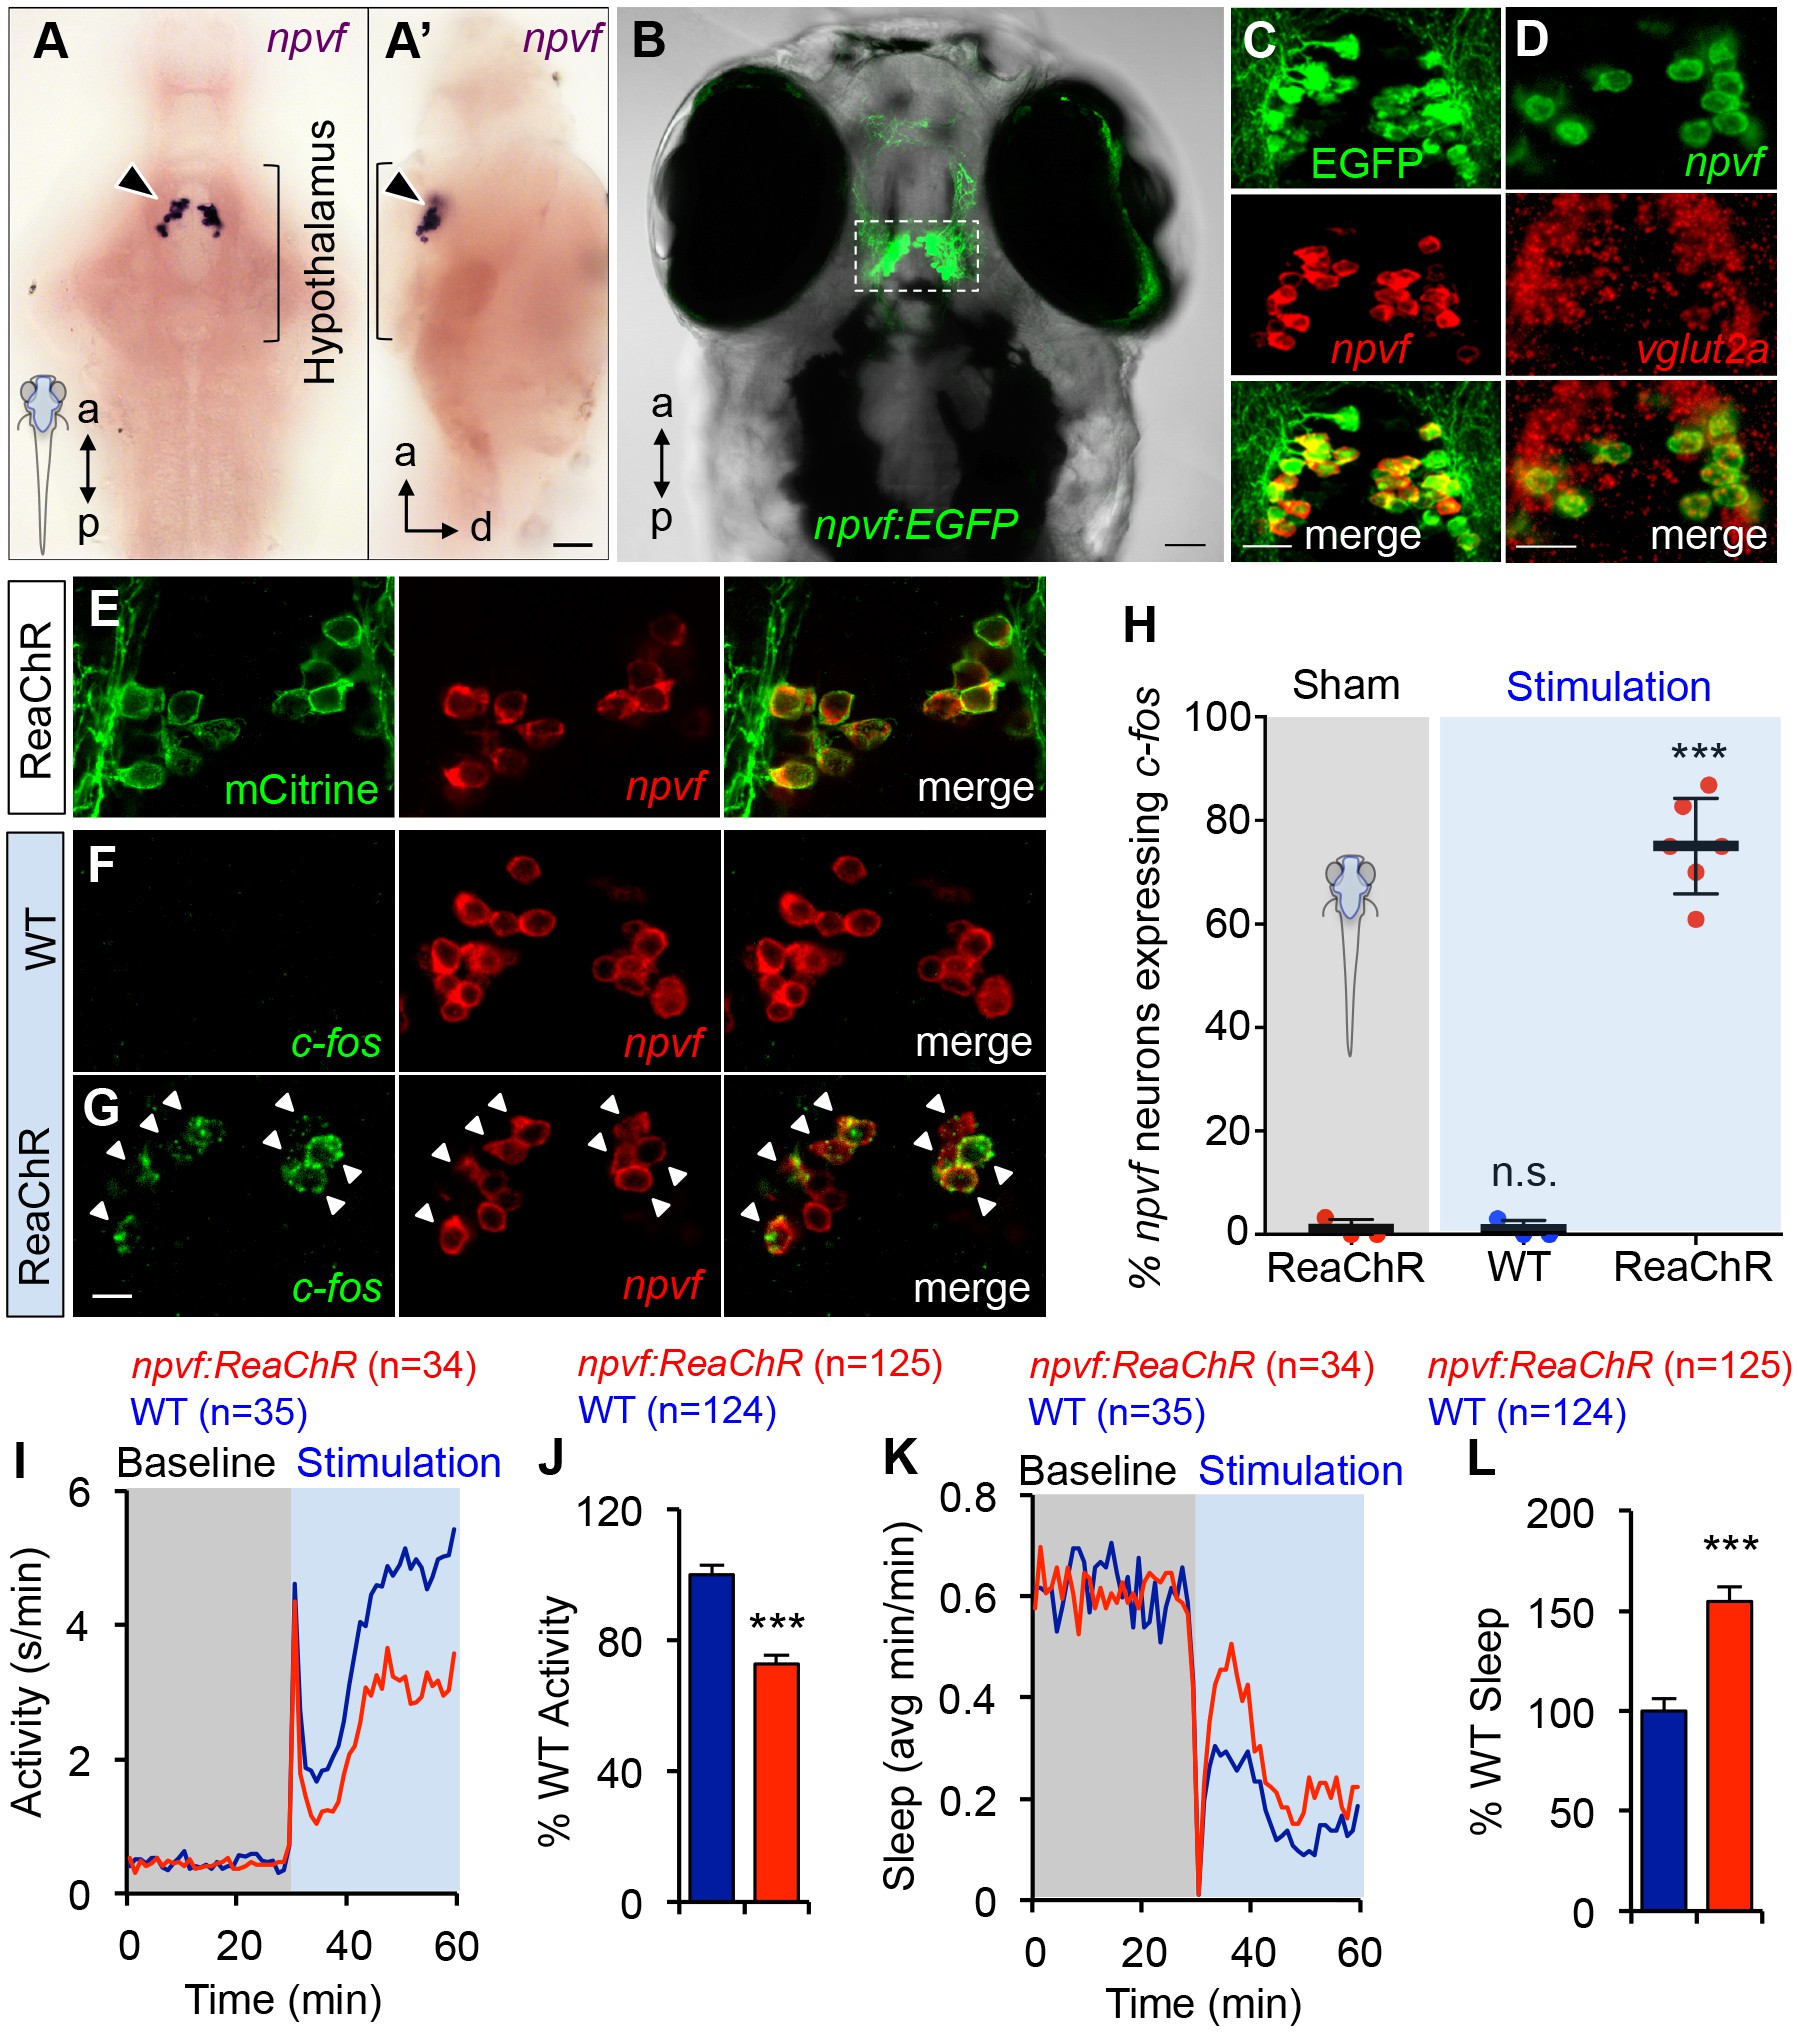
Optogenetic stimulation of NPVF neurons promotes sleep.
(A) ISH of NPVF neurons (arrowhead) in a 5-dpf brain. Ventral (A) and side (A’) views are shown. a, anterior; p, posterior; d, dorsal. (B) Live image of a 5-dpf Tg(npvf:EGFP) zebrafish with brightfield and EGFP overlay. White box demarcates region shown in subsequent images. (C) EGFP and npvf coexpression shown using EGFP immunohistochemistry (IHC) and npvf FISH in a 43.4 µm thick image stack. (D) npvf and vglut2a coexpression shown using FISH in a 2.7 µm thick image stack. (E) mCitrine and npvf coexpression in a Tg(npvf:ReaChR-mCitrine) zebrafish shown using EGFP IHC and npvf FISH in a 2.7 µm thick image stack. (F–H) Tg(npvf:ReaChR-mCitrine) and WT siblings were exposed to the same blue light stimulus used in (I–L). (G,H) 75.1 ± 4.1% of NPVF neurons expressed c-fos in Tg(npvf:ReaChR-mCitrine) animals (***p<0.0001; One-way ANOVA with Dunnett’s test to sham), in contrast to similarly stimulated WT siblings (~1%, n.s., not significant) (F,H), or to sham-treated transgenic animals (~1%). (I–L) Optogenetic stimulation of NPVF neurons decreased locomotor activity and increased sleep in transgenic animals compared to WT siblings. Data are from one representative experiment (I,K), or three pooled experiments (J,L). Activity and sleep of transgenic animals are normalized to WT and represented as mean ± SEM (J,L). n = number of animals. ***p<0.0001 by Student’s t-test. Scale: 50 μm (A,B), 20 μm (C,D), 10 μm (G). See also Table 1 and Figure 5—figure supplements 1,2.