
|
Fig. 3
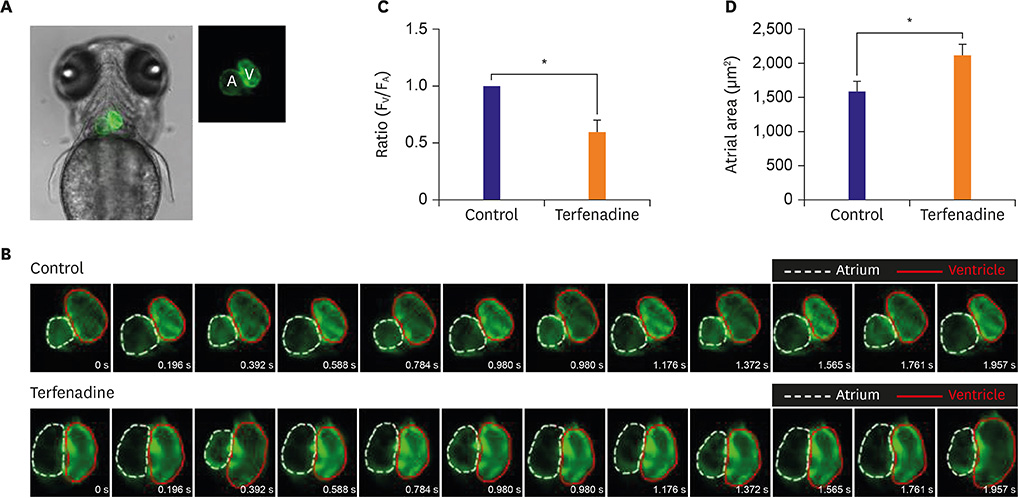
Atrioventricular dyssynchrony was induced after terfenadine treatment. (A) Representative image of cmlc-2:GFP transgenic zebrafish larvae. (B) Images taken from in vivo video recording at 4 dpf in the control (0.001% DMSO) and 24-hr terfenadine (20 μM)-treated zebrafish larvae. The interval between images in the montage is 0.196 seconds. Outlines of the atrium are shown with white dashed lines, and outlines of ventricles with red lines. (C) Arrhythmia rate of the control (0.001% DMSO) and 24-hr terfenadine (20 μM)-treated zebrafish larvae (n=20 zebrafish/group). (D) Atrial size of the control (0.001% DMSO) and 24-hr terfenadine (20 μM)-treated zebrafish larvae (n=20 zebrafish/group).
A = atrium; DMSO = dimethyl sulfoxide; dpf = days post fertilization; FV/FA = fetal ventricle/fatal atrium; V = ventricle.
*p<0.050.