
|
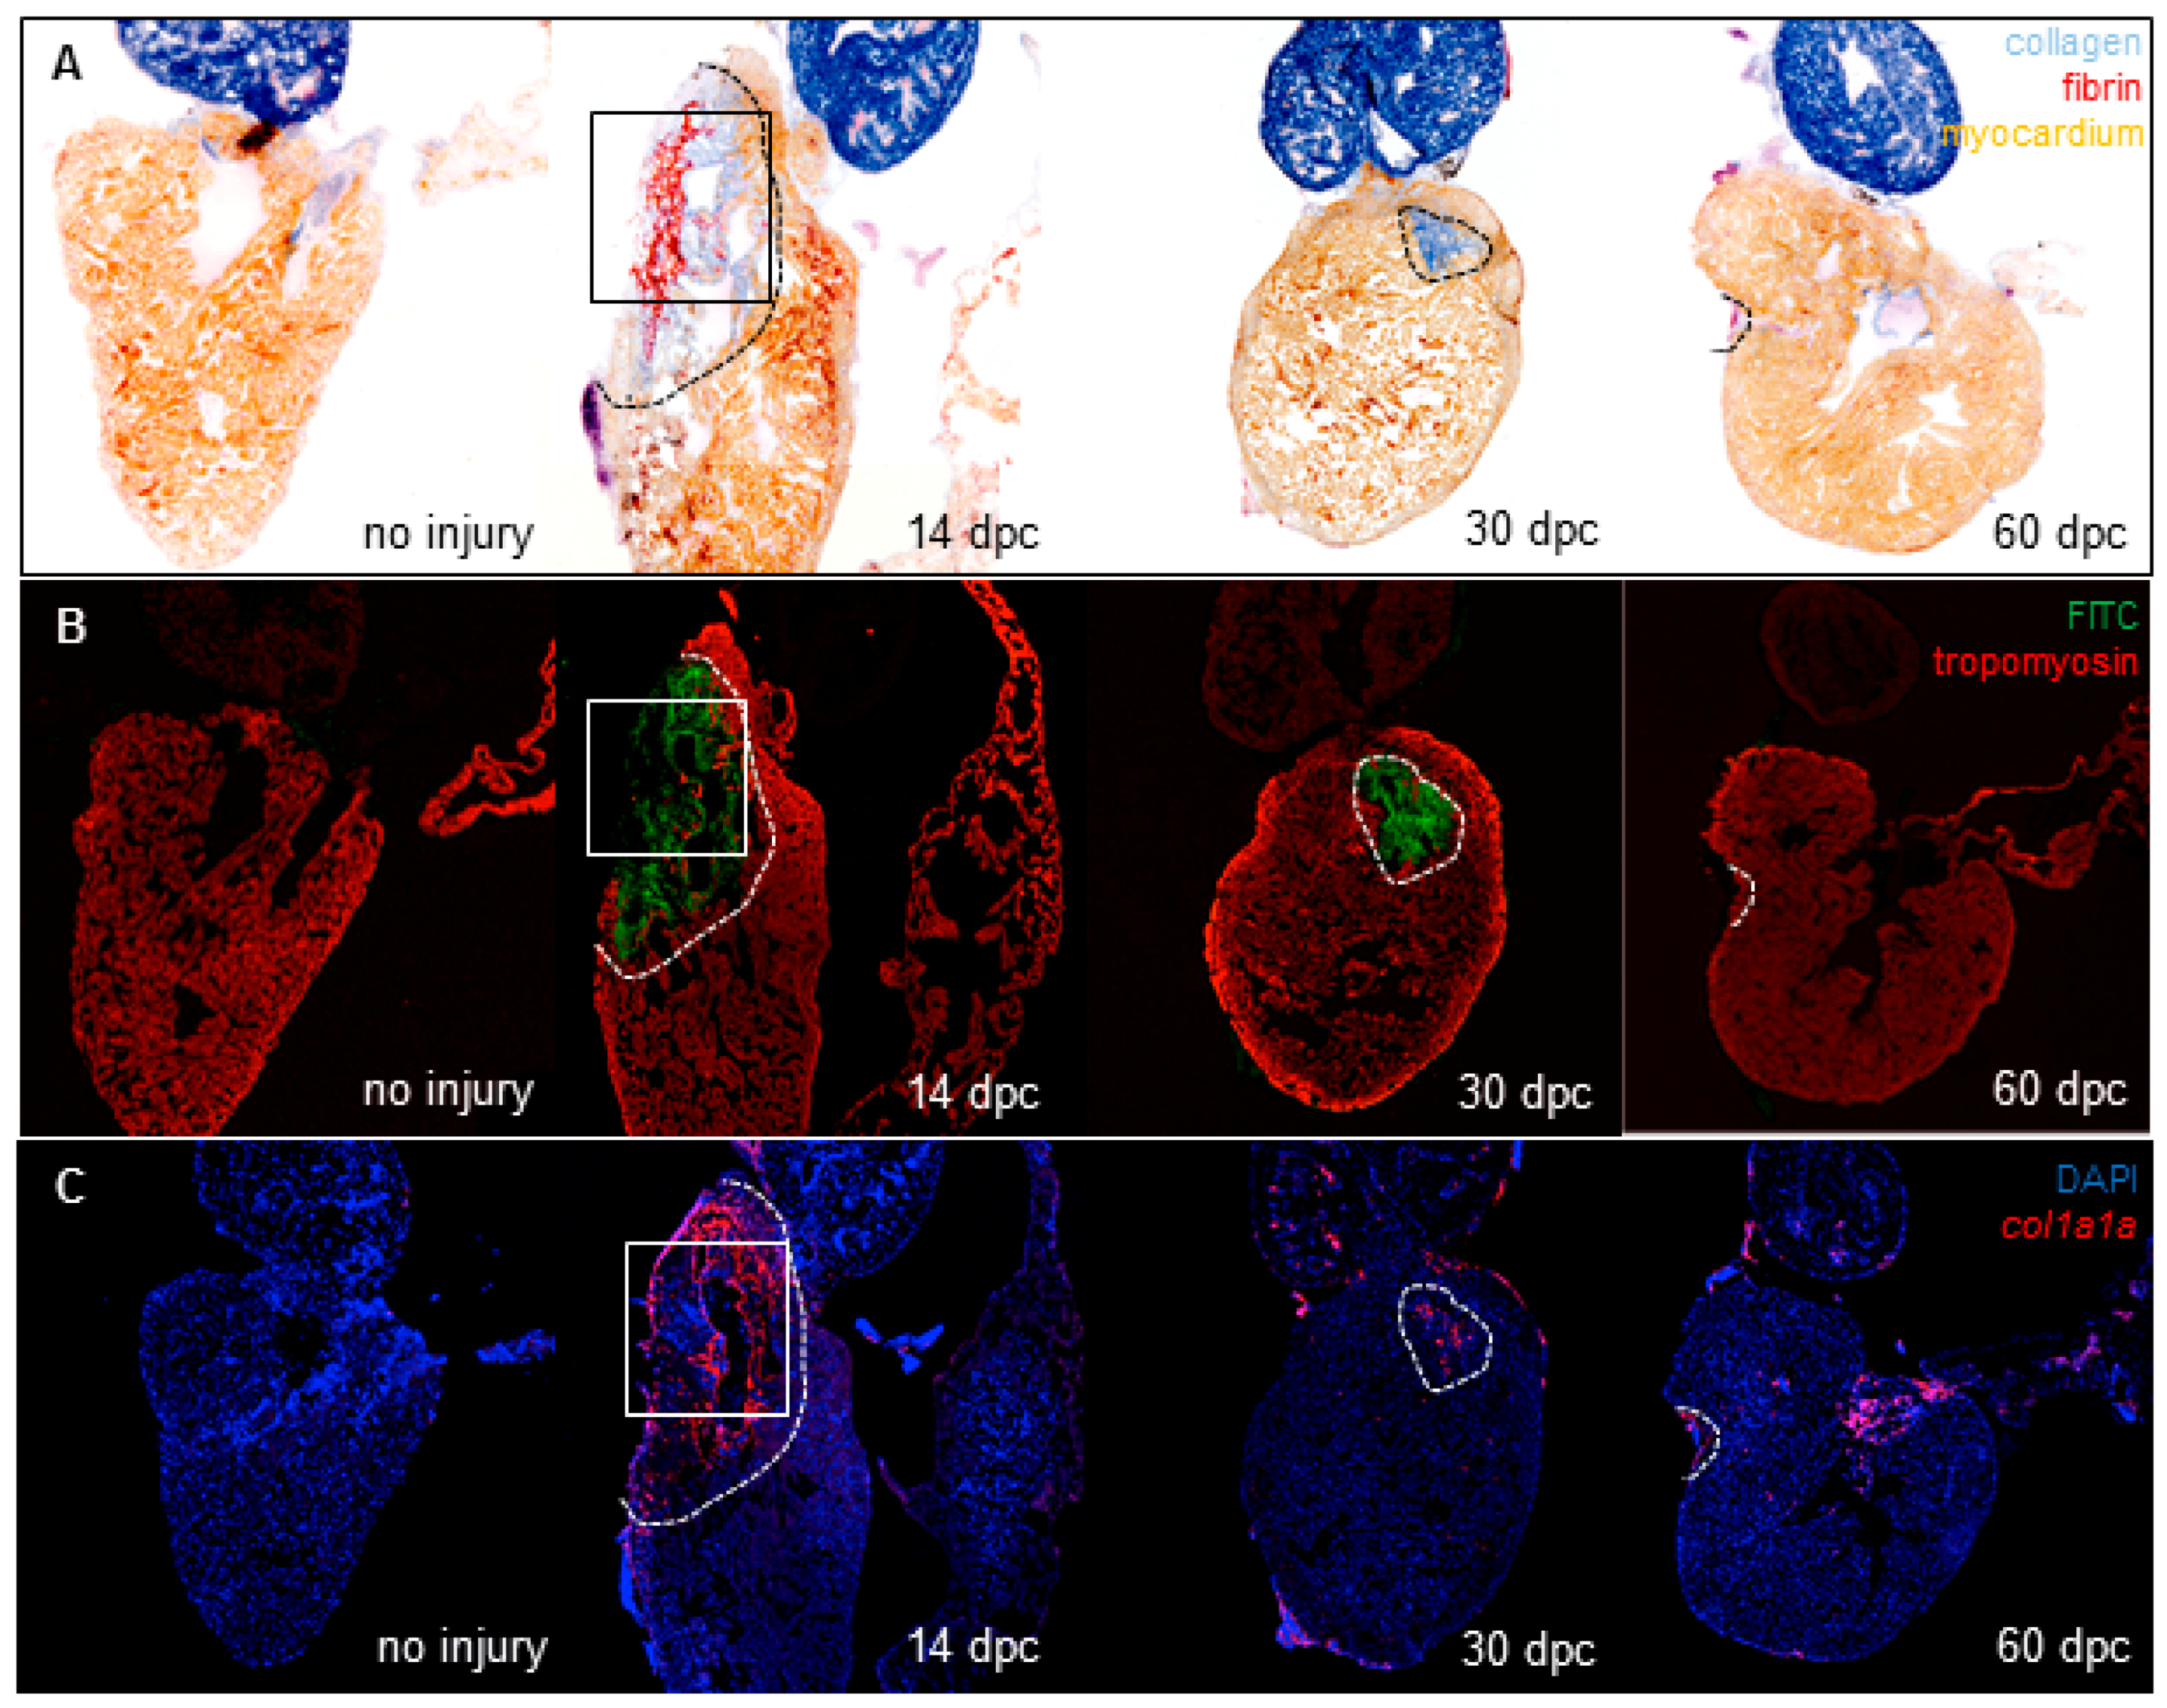
Fig. 1 Collagenolytic activity and fibroblast activation during heart regeneration. (A) Wound area visualized with AFOG staining of frozen sections from uninjured hearts (n = 3) or hearts at 14 dpc (n = 7), 30 dpc (n = 8) and 60 dpc (n = 6) (fibrin in red, collagen in blue, and counterstaining in orange); (B) Confocal imaging of consecutive sections from hearts stained in (A). Green fluorescence represents the release of fluorescein activity due to the degradation of DQ-collagen substrate. Tropomyosin immunostaining is used as counterstaining (red fluorescence); (C) col1a1a expression by fluorescent in situ hybridization on consecutive sections from the same hearts shown in (A,B). col1a1a mRNA in red, nuclei in blue (DAPI). Comparison of collagenolytic activity (B’) and fibroblasts (C’) with collagen (A’) on consecutive sections of the 14 dpc heart at a 20× magnification (magnification of the boxes in (A–C) respectively). Dashed lines represent the wound area.