
Fig. 3
|
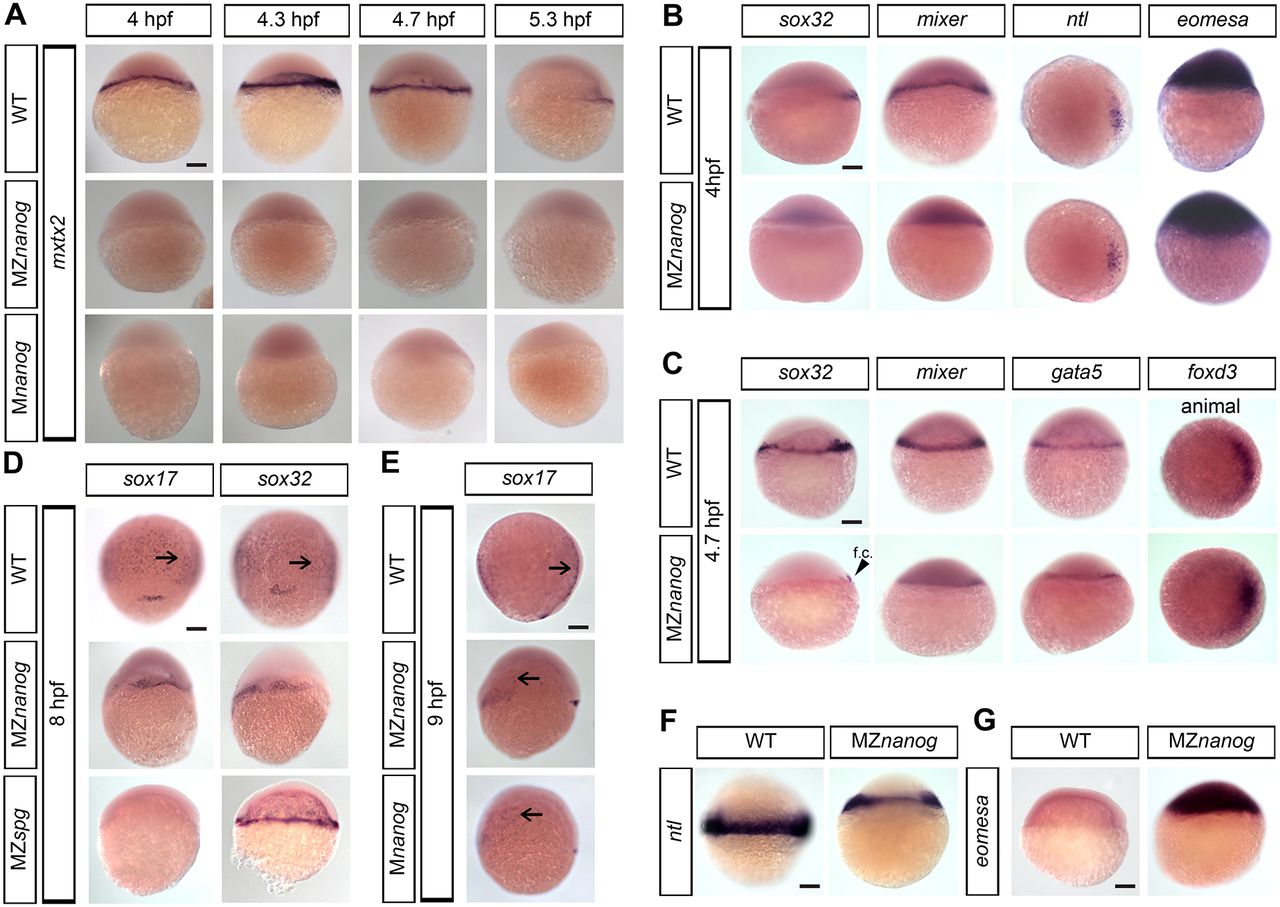
Fig. 3 Expression of mxtx2, eomesa and endomesodermal markers in Nanog mutants. Expression of the indicated genes in wild-type (WT), Mnanog and MZnanog embryos was visualized by in situ hybridization. Dorsal is to the right. (A) mxtx2 expression is absent in MZnanog and Mnanog (lateral view). (B) Sphere stage expression of sox32, mixer and eomesa (lateral view) and ntl (animal view). Note that sox32 and mixer are not detectable in MZnanog, but ntl and eomesa expression is not altered. (C) 30% epiboly stage expression for sox32, mixer, gata5 (lateral view) and foxD3 (animal view). f.c., forerunner cells (arrowhead). (D) sox17 and sox32 staining at 8 hpf in WT, MZnanog and MZspg (dorsal view). Note that sox17 and sox32 are both expressed in MZnanog, but only sox32 is expressed in MZspg. (E) sox17 staining in WT, MZnanog and Mnanog (9 hpf, lateral view). In D,E, arrows show scattered endodermal cells. (F) ntl expression at 6 hpf (lateral view). (G) eomesa expression at 5.3 hpf (lateral view). Scale bars: 100 µm.