
|
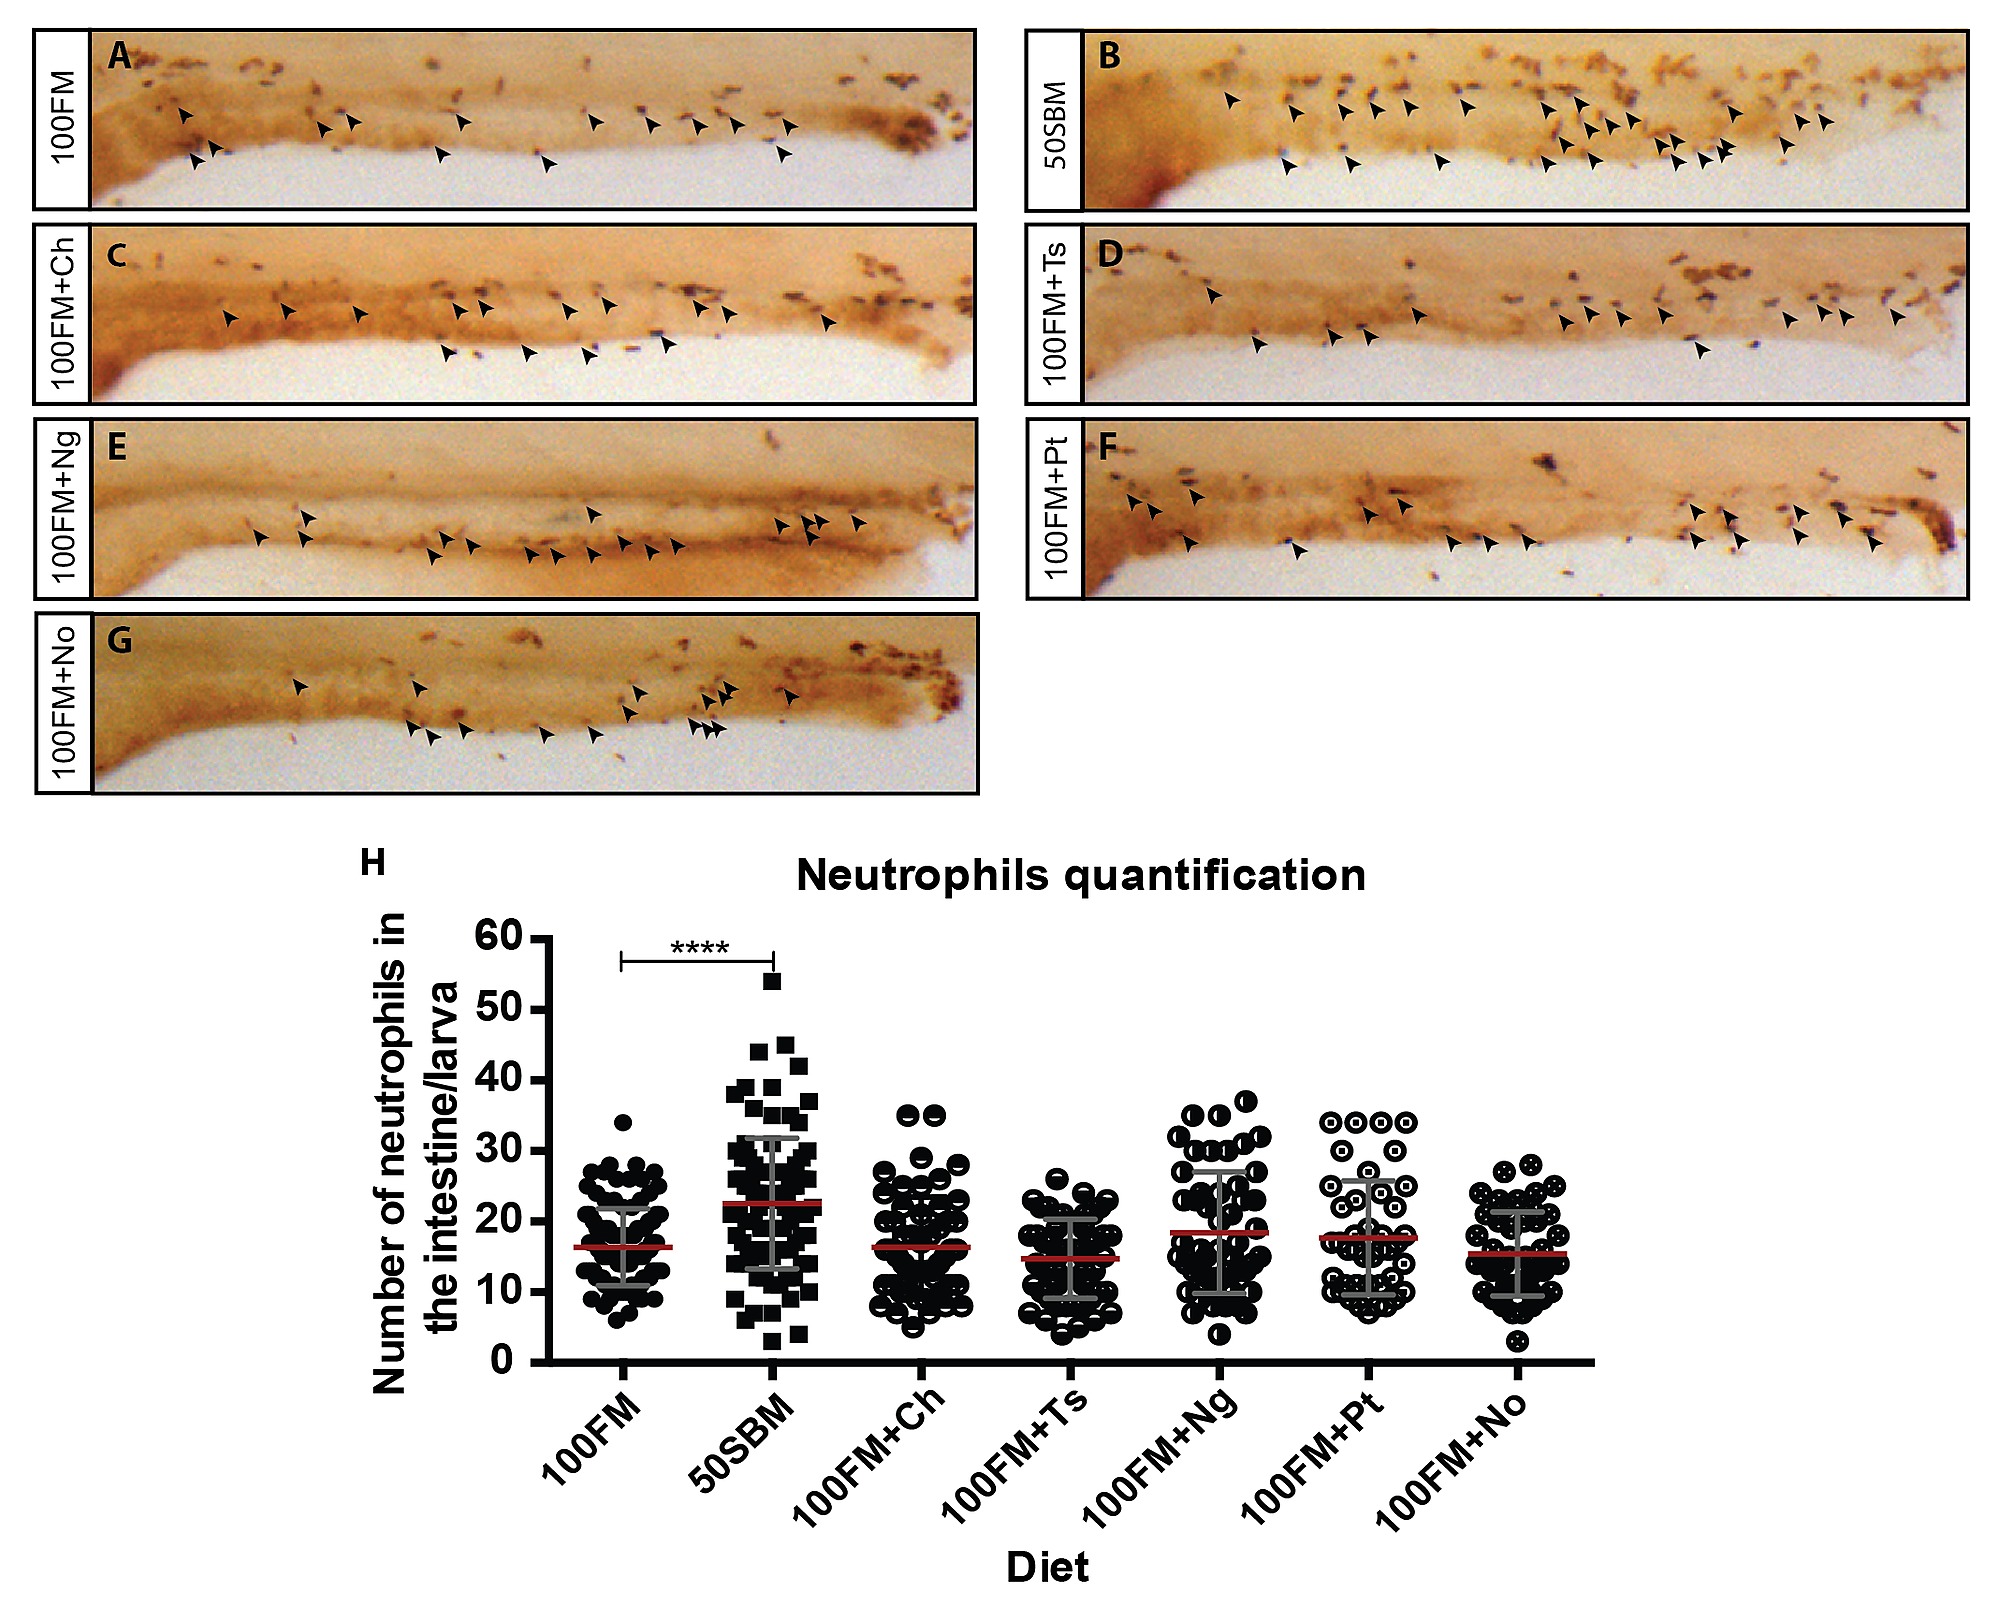
Fig. s1
Effect of microalgae on immune response.
(A-G) Lateral view of 9 dpf Tg(BACmpo:GFP)i114 larvae after four days of feeding with the different diets; fishmeal (100FM), soybean meal (50SBM), and fishmeal + microalgae: 100FM+Ch, 100FM+Ts, 100FM+A3Ng, 100FM+Pt, or 100FM+No. Black arrowheads indicate neutrophils. (H) The amount of intestinal neutrophils was quantified by immunohistochemistry against GFP. At least 25 larvae per diet were analyzed in three different experiments. Statistical analysis was conducted using a non-parametric one-way ANOVA. ****P < 0.0001. Red bars represent the mean, and gray bars represent standard deviation.