
Image
|
Figure Caption
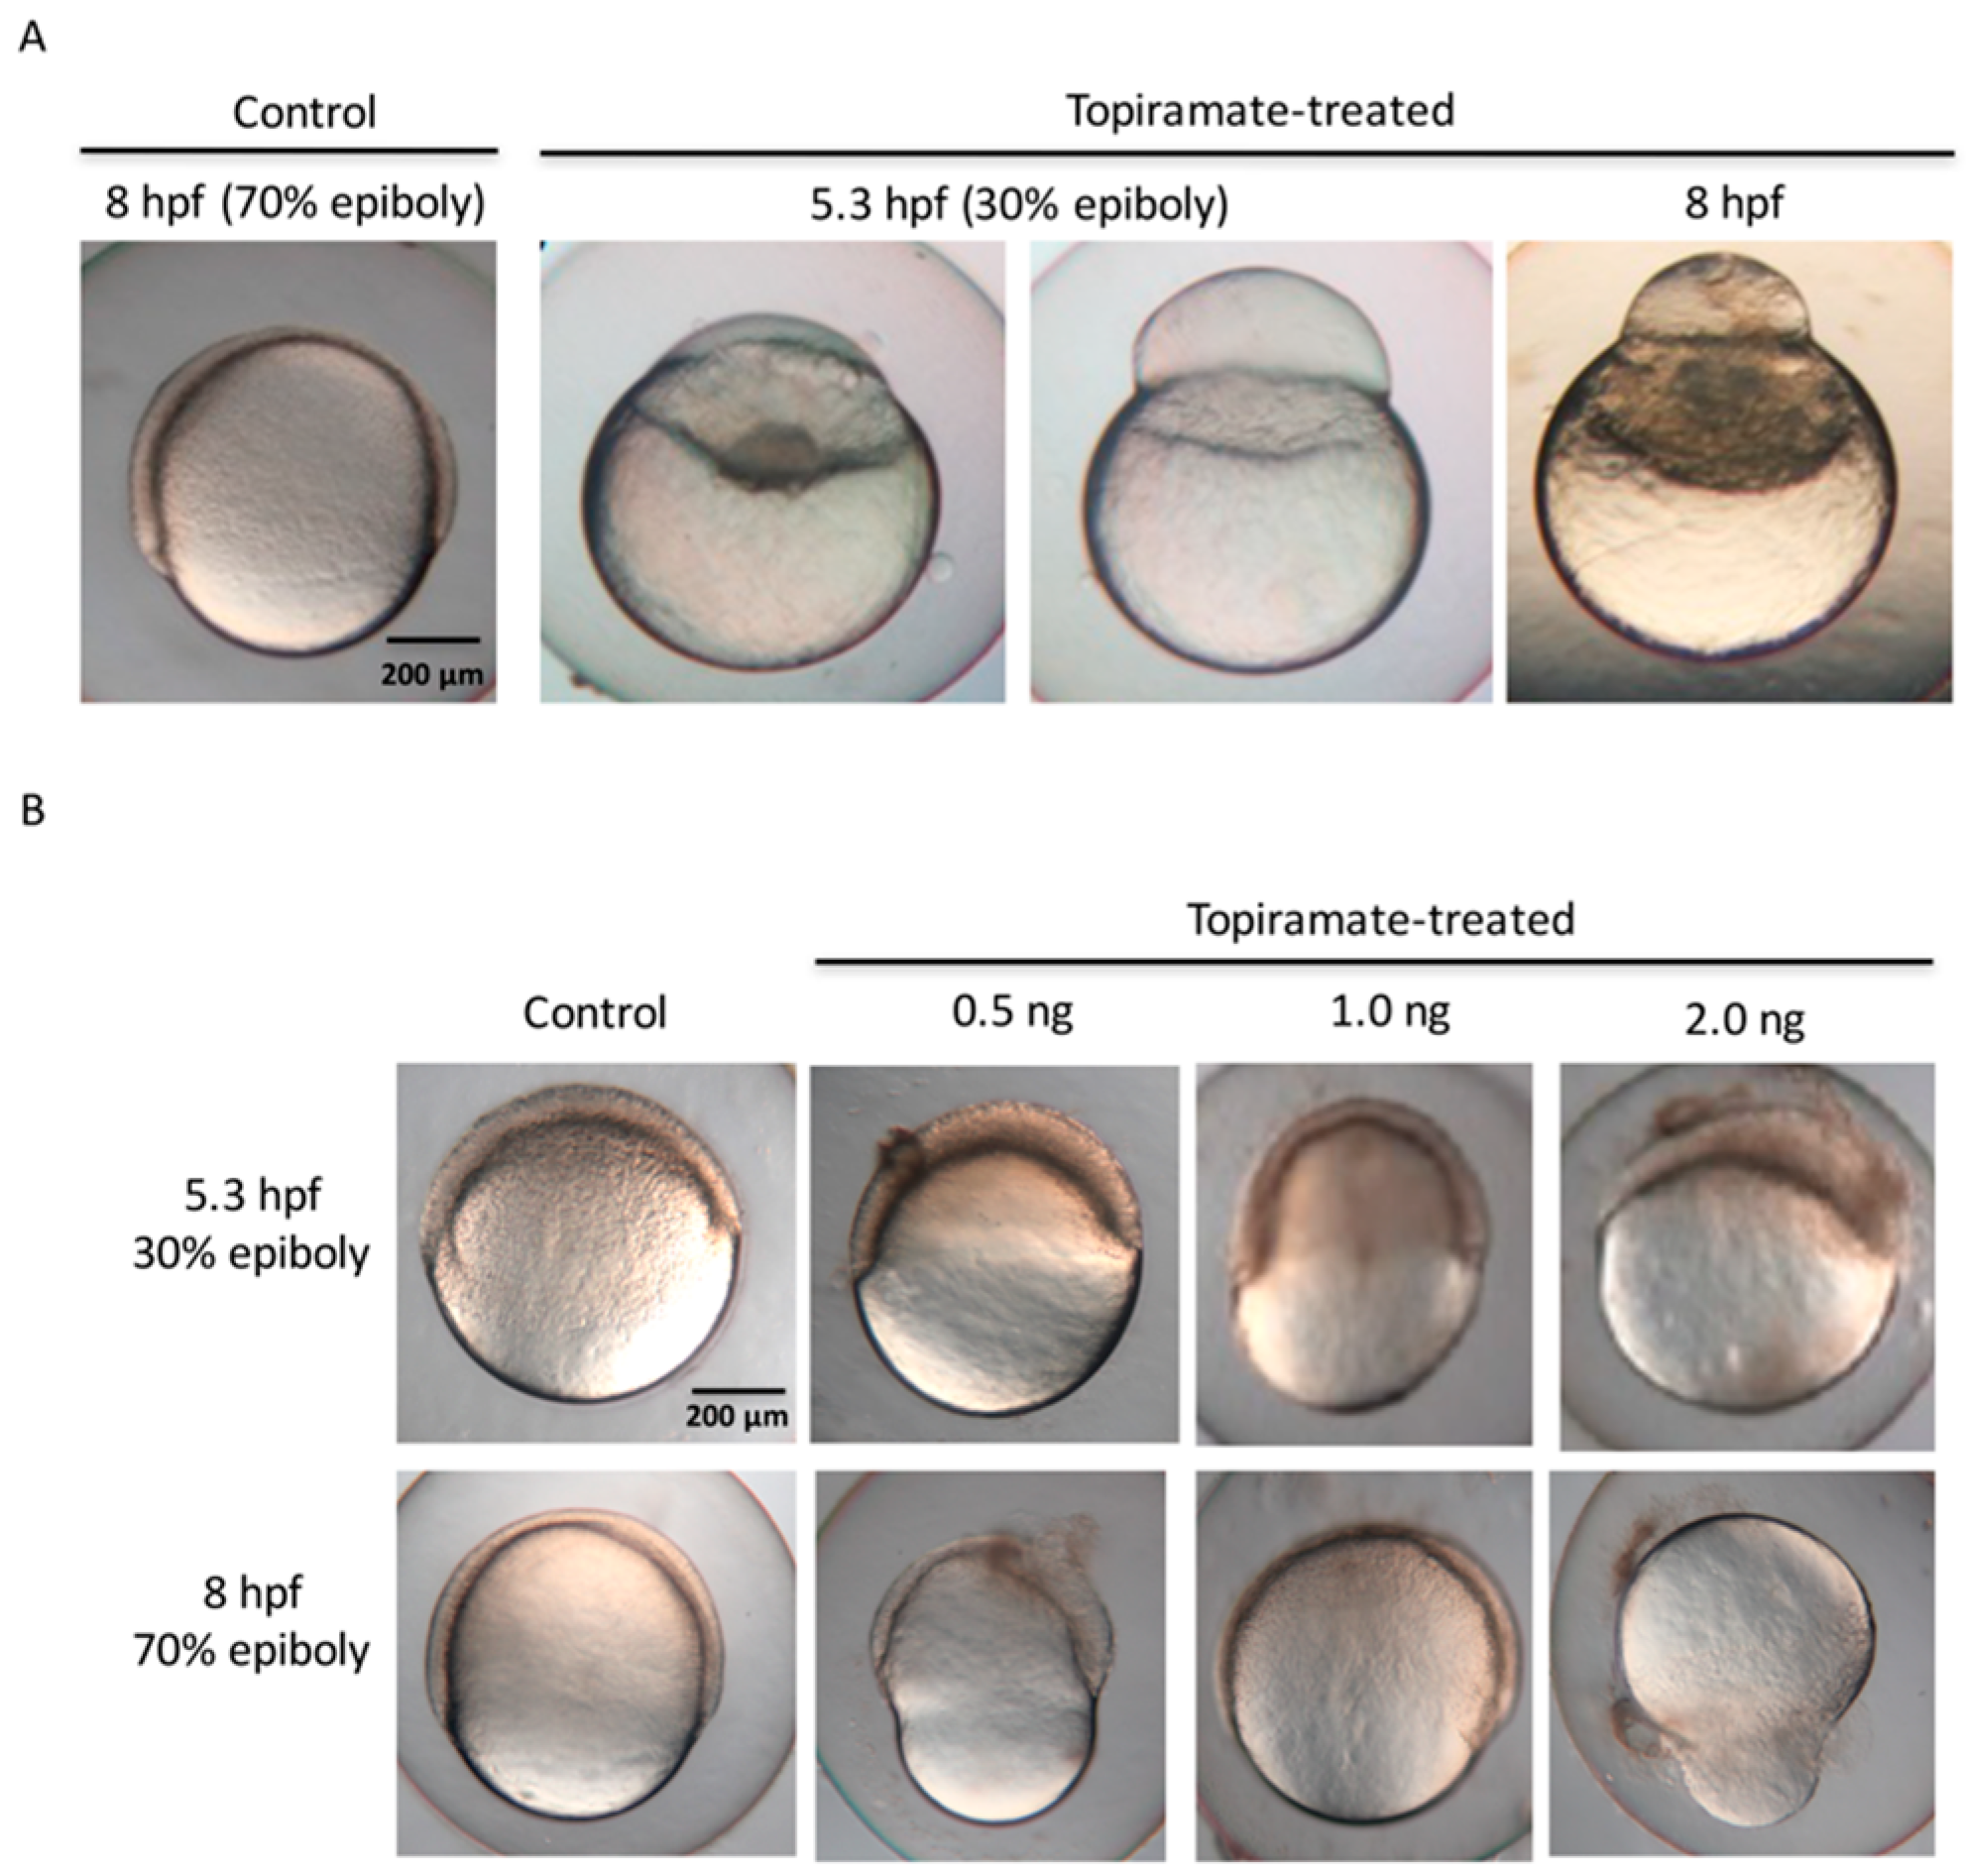
Fig. 2
Embryonic epiboly deficiency in topiramate-treated offspring. (A) Embryonic development observation from control and topiramate-treated offspring. Morphology at 8 hpf in the control group showed normal epiboly progression. Embryos from topiramate-treated female fish were abnormally expressed during epiboly progression from 5.3 hpf; (B) embryonic development observation from control and topiramate-injected embryos at 5.3 and 8 hpf. Scale bar: 200 μm.
Acknowledgments
This image is the copyrighted work of the attributed author or publisher, and
ZFIN has permission only to display this image to its users.
Additional permissions should be obtained from the applicable author or publisher of the image.
Full text @ Int. J. Mol. Sci.