
Image
|
Figure Caption
Fig. 3
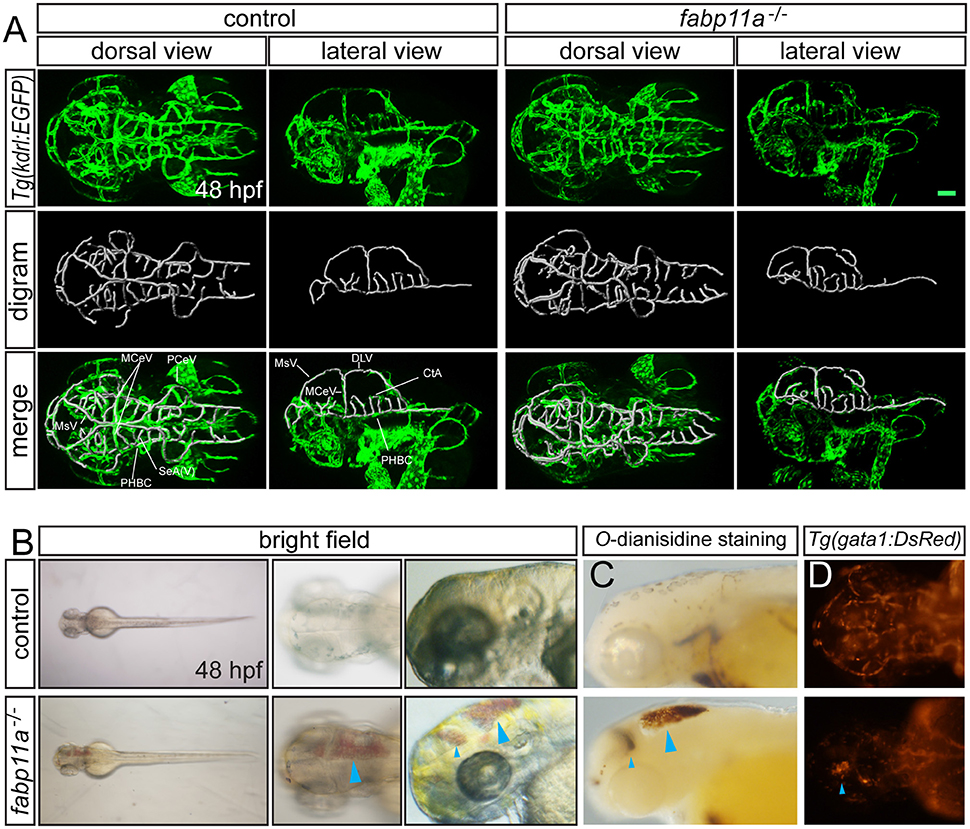
fabp11a knockout leads to zebrafish brain hemorrhage. (A) Confocal imaging analysis of brain vascular morphology in control and fabp11a mutants Tg(kdrl:EGFP) embryos at 48 hpf. (B) Microscopy analysis of control embryos and fabp11a mutants in bright field at 48 hpf. Blue arrowheads indicate hemorrhage in zebrafish head. (C) Microscope analysis of control embryos and fabp11a mutants with O-dianisidine staining in bright field at 48 hpf. Blue arrowheads indicate hemorrhage in zebrafish head. (D) Fluorescent microscopy imaging of Tg(gata1:DsRed) embryos at 48 hpf. Scale bar: 20 μm.
Figure Data
Acknowledgments
This image is the copyrighted work of the attributed author or publisher, and
ZFIN has permission only to display this image to its users.
Additional permissions should be obtained from the applicable author or publisher of the image.
Full text @ Front. Physiol.