
|
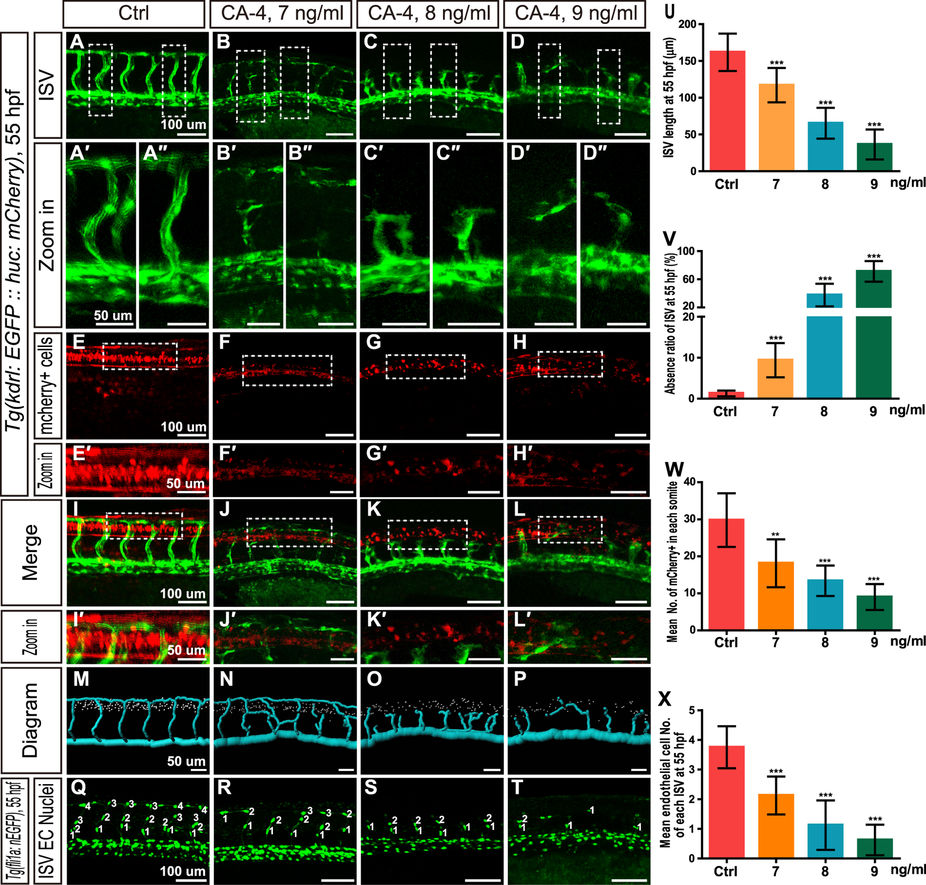
Fig. 2
Effects of CA-4 treatment on vascular and central nervous systems in the trunk of Tg(kdrl:EGFP::huc:mcherry) and Tg(fli1a:nEGFP) zebrafish embryos at 55 hpf.
(A–D) ISV phenotypes of control group and 7, 8, 9 ng/ml CA-4 treated groups. Scale bar, 100 μm. (A′–D″) Zoomed in images of regions in dash line rectangles of panel (A–D). Scale bar, 50 μm. (E–H) mCherry positive cells in neural tubes of control group and 7, 8, 9 ng/ml CA-4 treated groups. Scale bar, 100 μm. (E′–H′) Zoomed in images of regions in dash line rectangles of panel E-H. Scale bar, 50 μm. (I–L) Merged images of (A–H). Scale bar, 100 μm. (I′–L′) Zoomed in images of regions in dash line rectangles of panel I-L. Scale bar, 50 μm. (M–P) Diagrams of ISVs and neuronal precursor cells in different groups. Scale bar, 50 μm. (Q–T) Endothelial nuclei of control group and 7, 8, 9 ng/ml CA-4 treated groups. Scale bar, 100 μm. (U–X) Statistical analyses of ISV length, ISV absence ratio, number of neuronal precursor cell in each somite, and mean endothelial cell number of each ISV in control group and 7, 8, 9 ng/ml CA-4 treated groups. Data were expressed as the mean ± S.E.M. (n = 8). **P < 0.01 and ***P < 0.001 vs. control group.