
IMAGE
Fig. 1
Image
|
Figure Caption
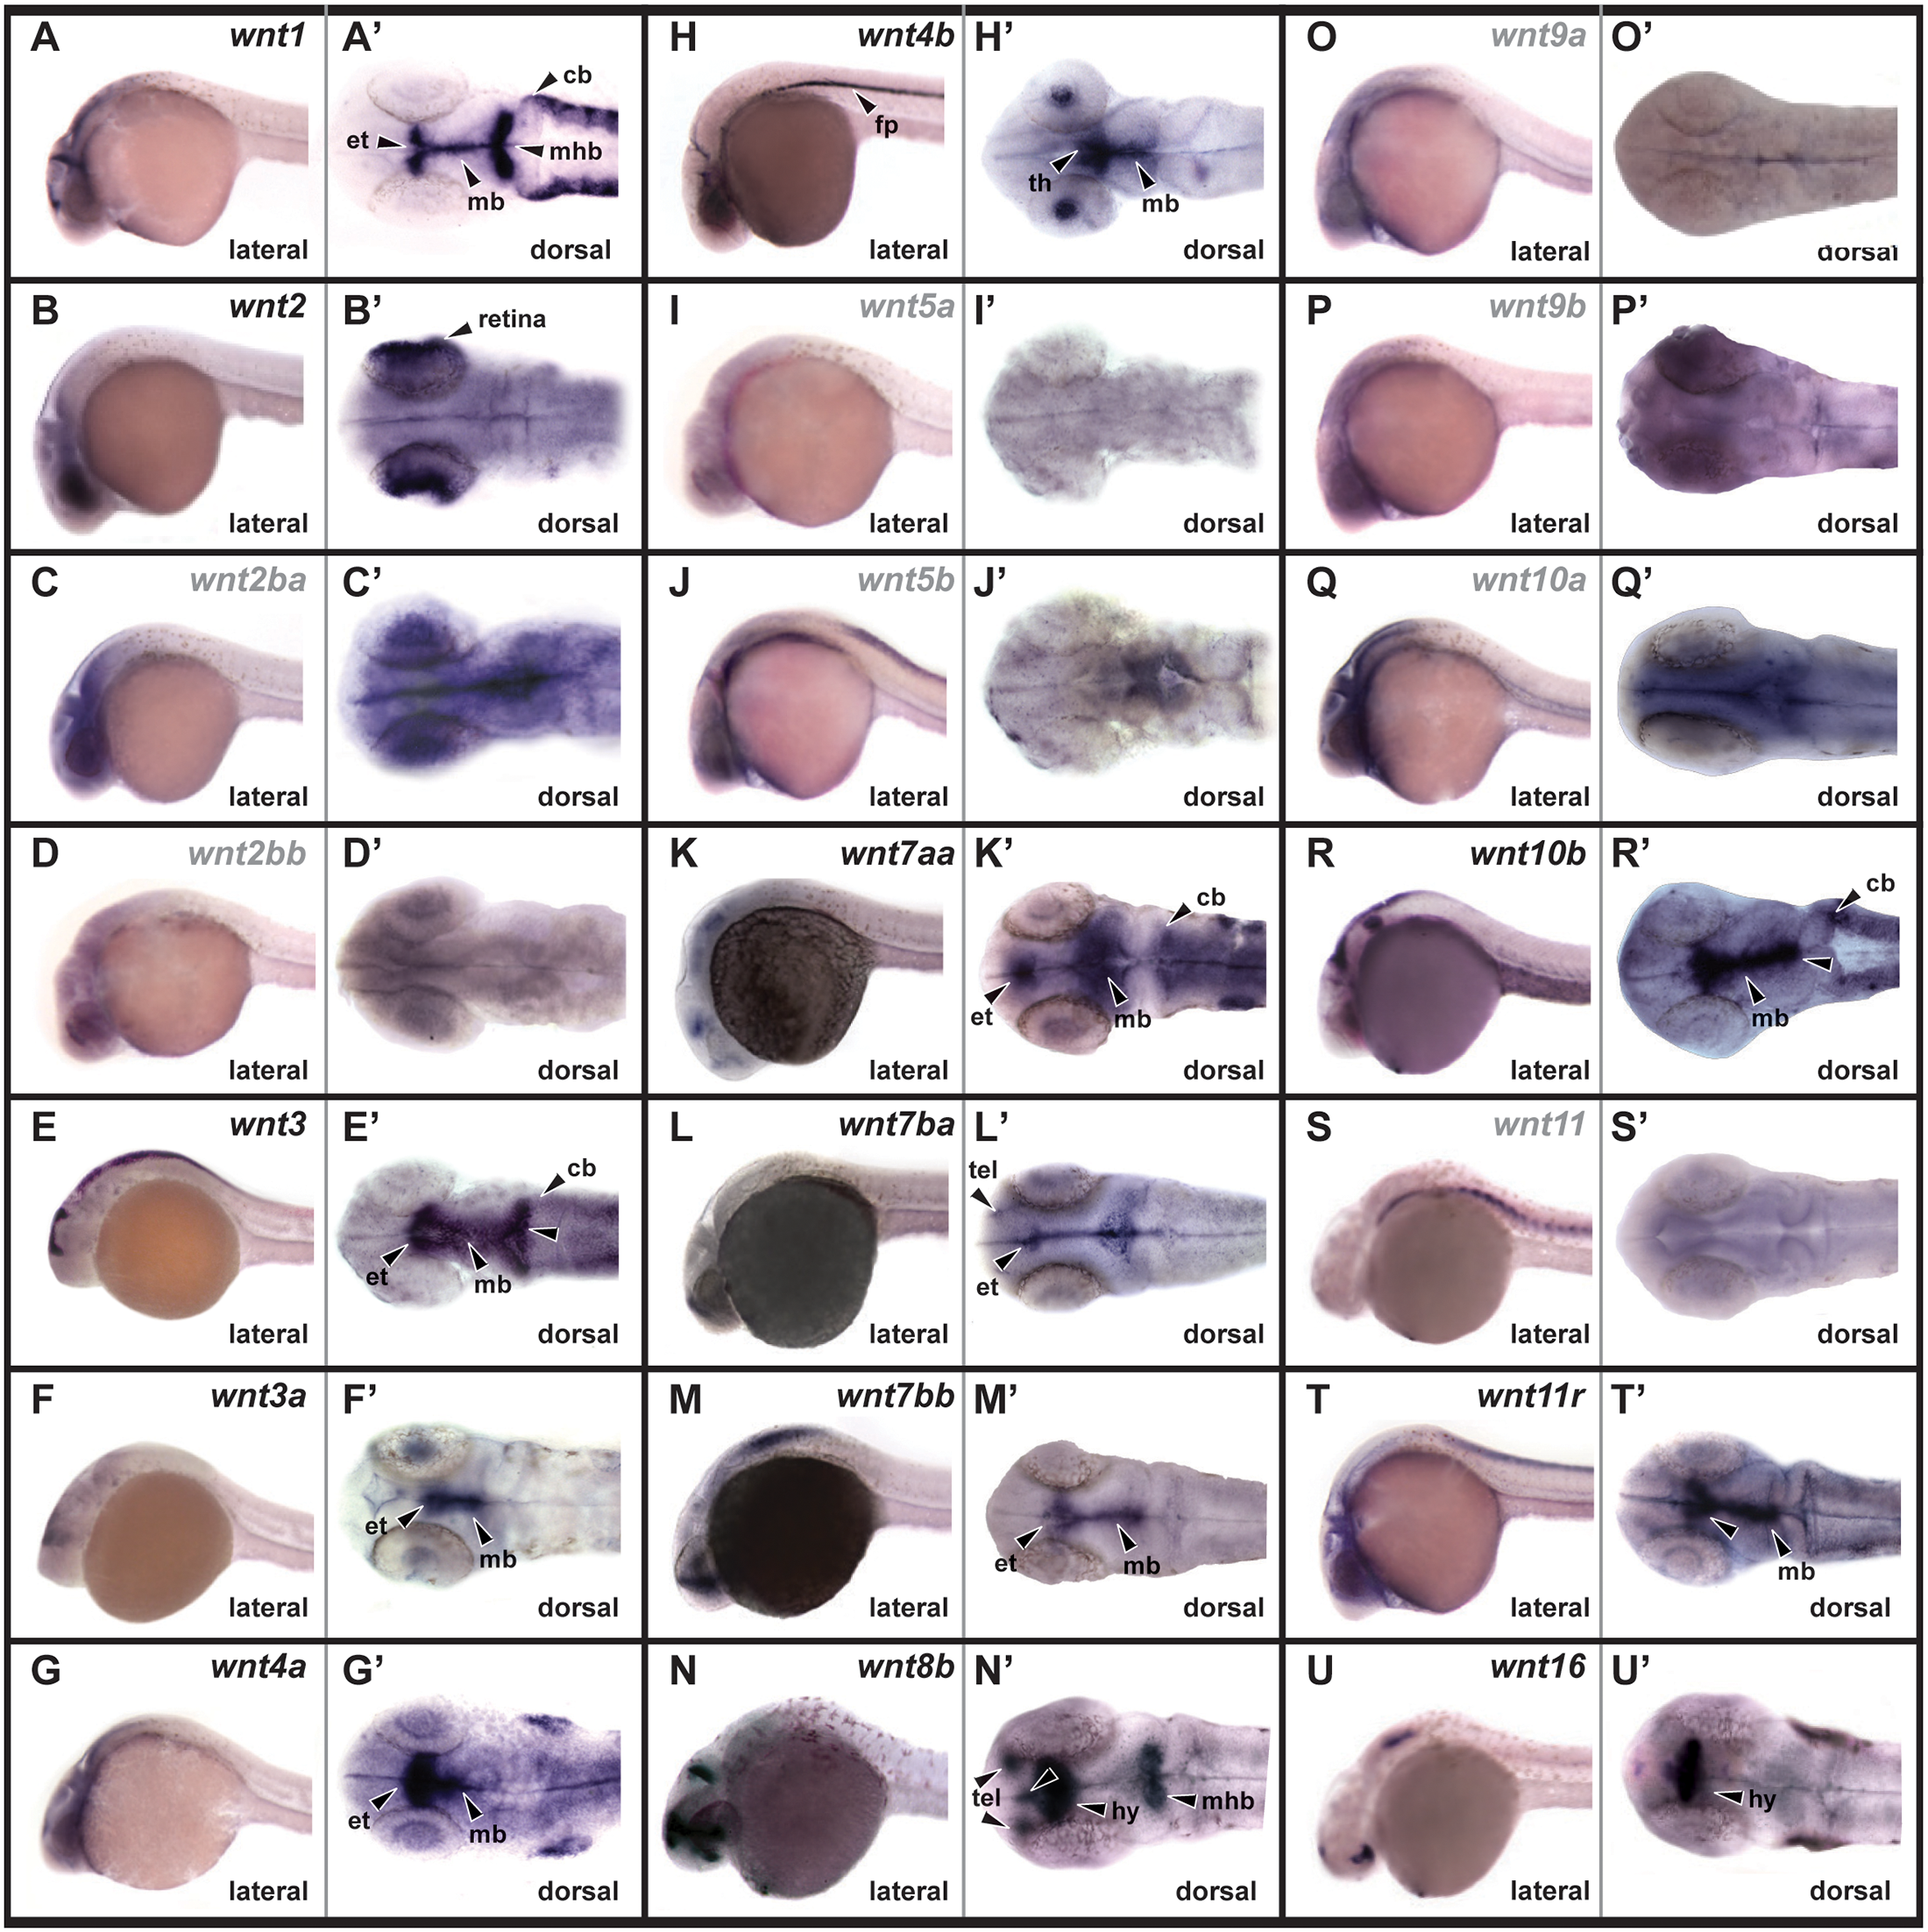
Fig. 1
Wnt gene expression at 24 hpf.
Lateral views of whole embryos are shown in left panels, and dorsal views of dissected brains are shown in right panels. Genes with nonspecific brain expression are indicated with grey text. tel, telencephalon; et, epithalamus; th, thalamus; hy, hypothalamus; mb, midbrain; mhb, midbrain-hindbrain boundary; cb, cerebellum; fp, floor plate.
Figure Data
Acknowledgments
This image is the copyrighted work of the attributed author or publisher, and
ZFIN has permission only to display this image to its users.
Additional permissions should be obtained from the applicable author or publisher of the image.
Full text @ PLoS One