
Image
|
Figure Caption
Fig. S4
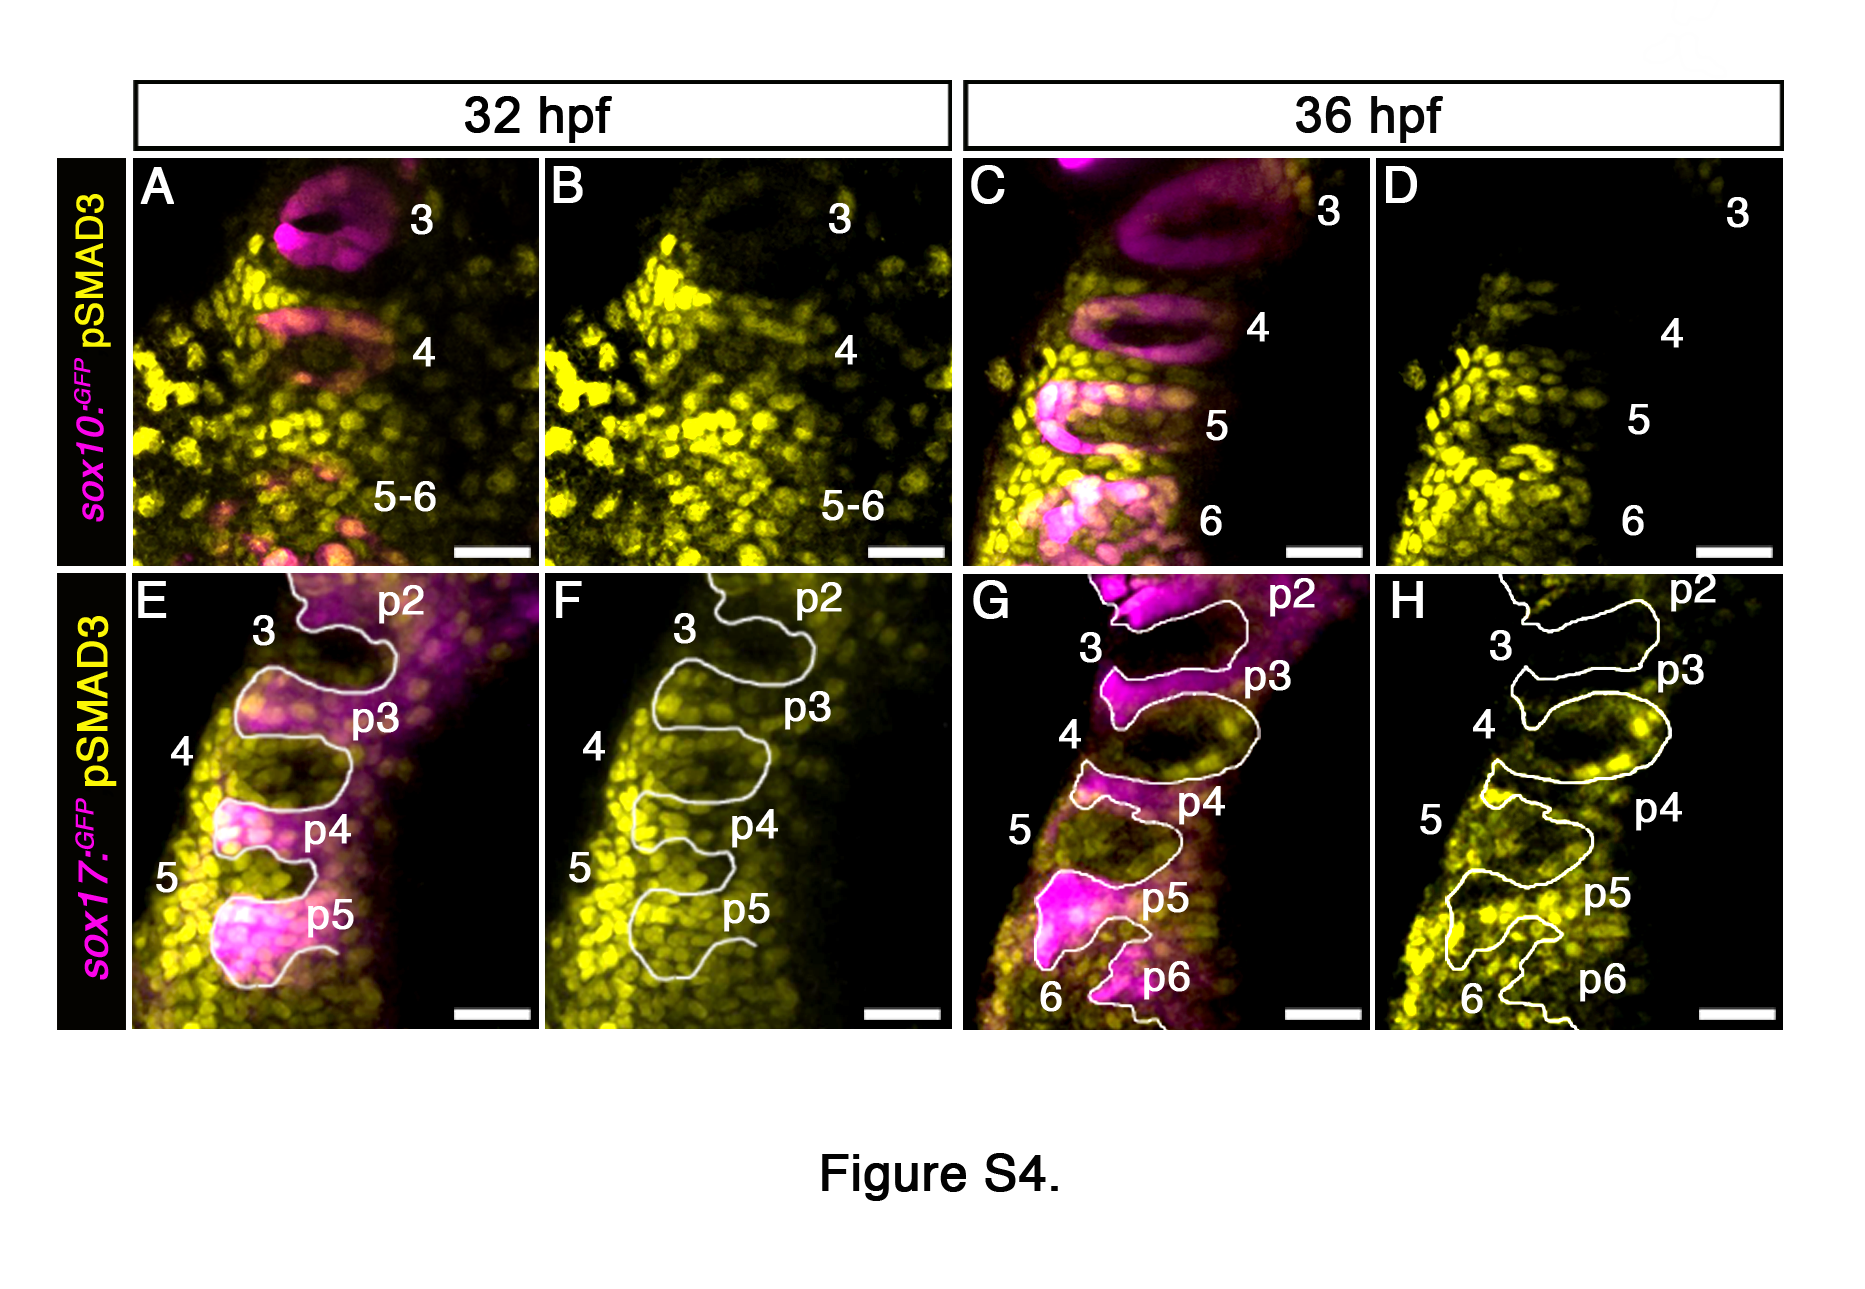
A wave of TGFβ signaling is observed throughout the pharynx, Related to Figure 5.
(A-H) Spatiotemporal dynamics of TGFb signaling during PAA angioblast differentiation. Dorsal views of Tg(sox10):GFP) or Tg(sox17:GFP) embryos at the indicated developmental stages immunostained for GFP and pSMAD3 imaged in the green and far red channels to visualize neural crest (sox10) or endodermal pouches (sox17) (pseudocolored magenta) and cells experiencing active TGFβ signaling (pseudocolored yellow). 32 hpf, n=3 embryos; 36 hpf, n=6 embryos. Scale bars = 25μm.
Figure Data
Acknowledgments
This image is the copyrighted work of the attributed author or publisher, and
ZFIN has permission only to display this image to its users.
Additional permissions should be obtained from the applicable author or publisher of the image.
Full text @ Cell Rep.