
|
Fig. 1
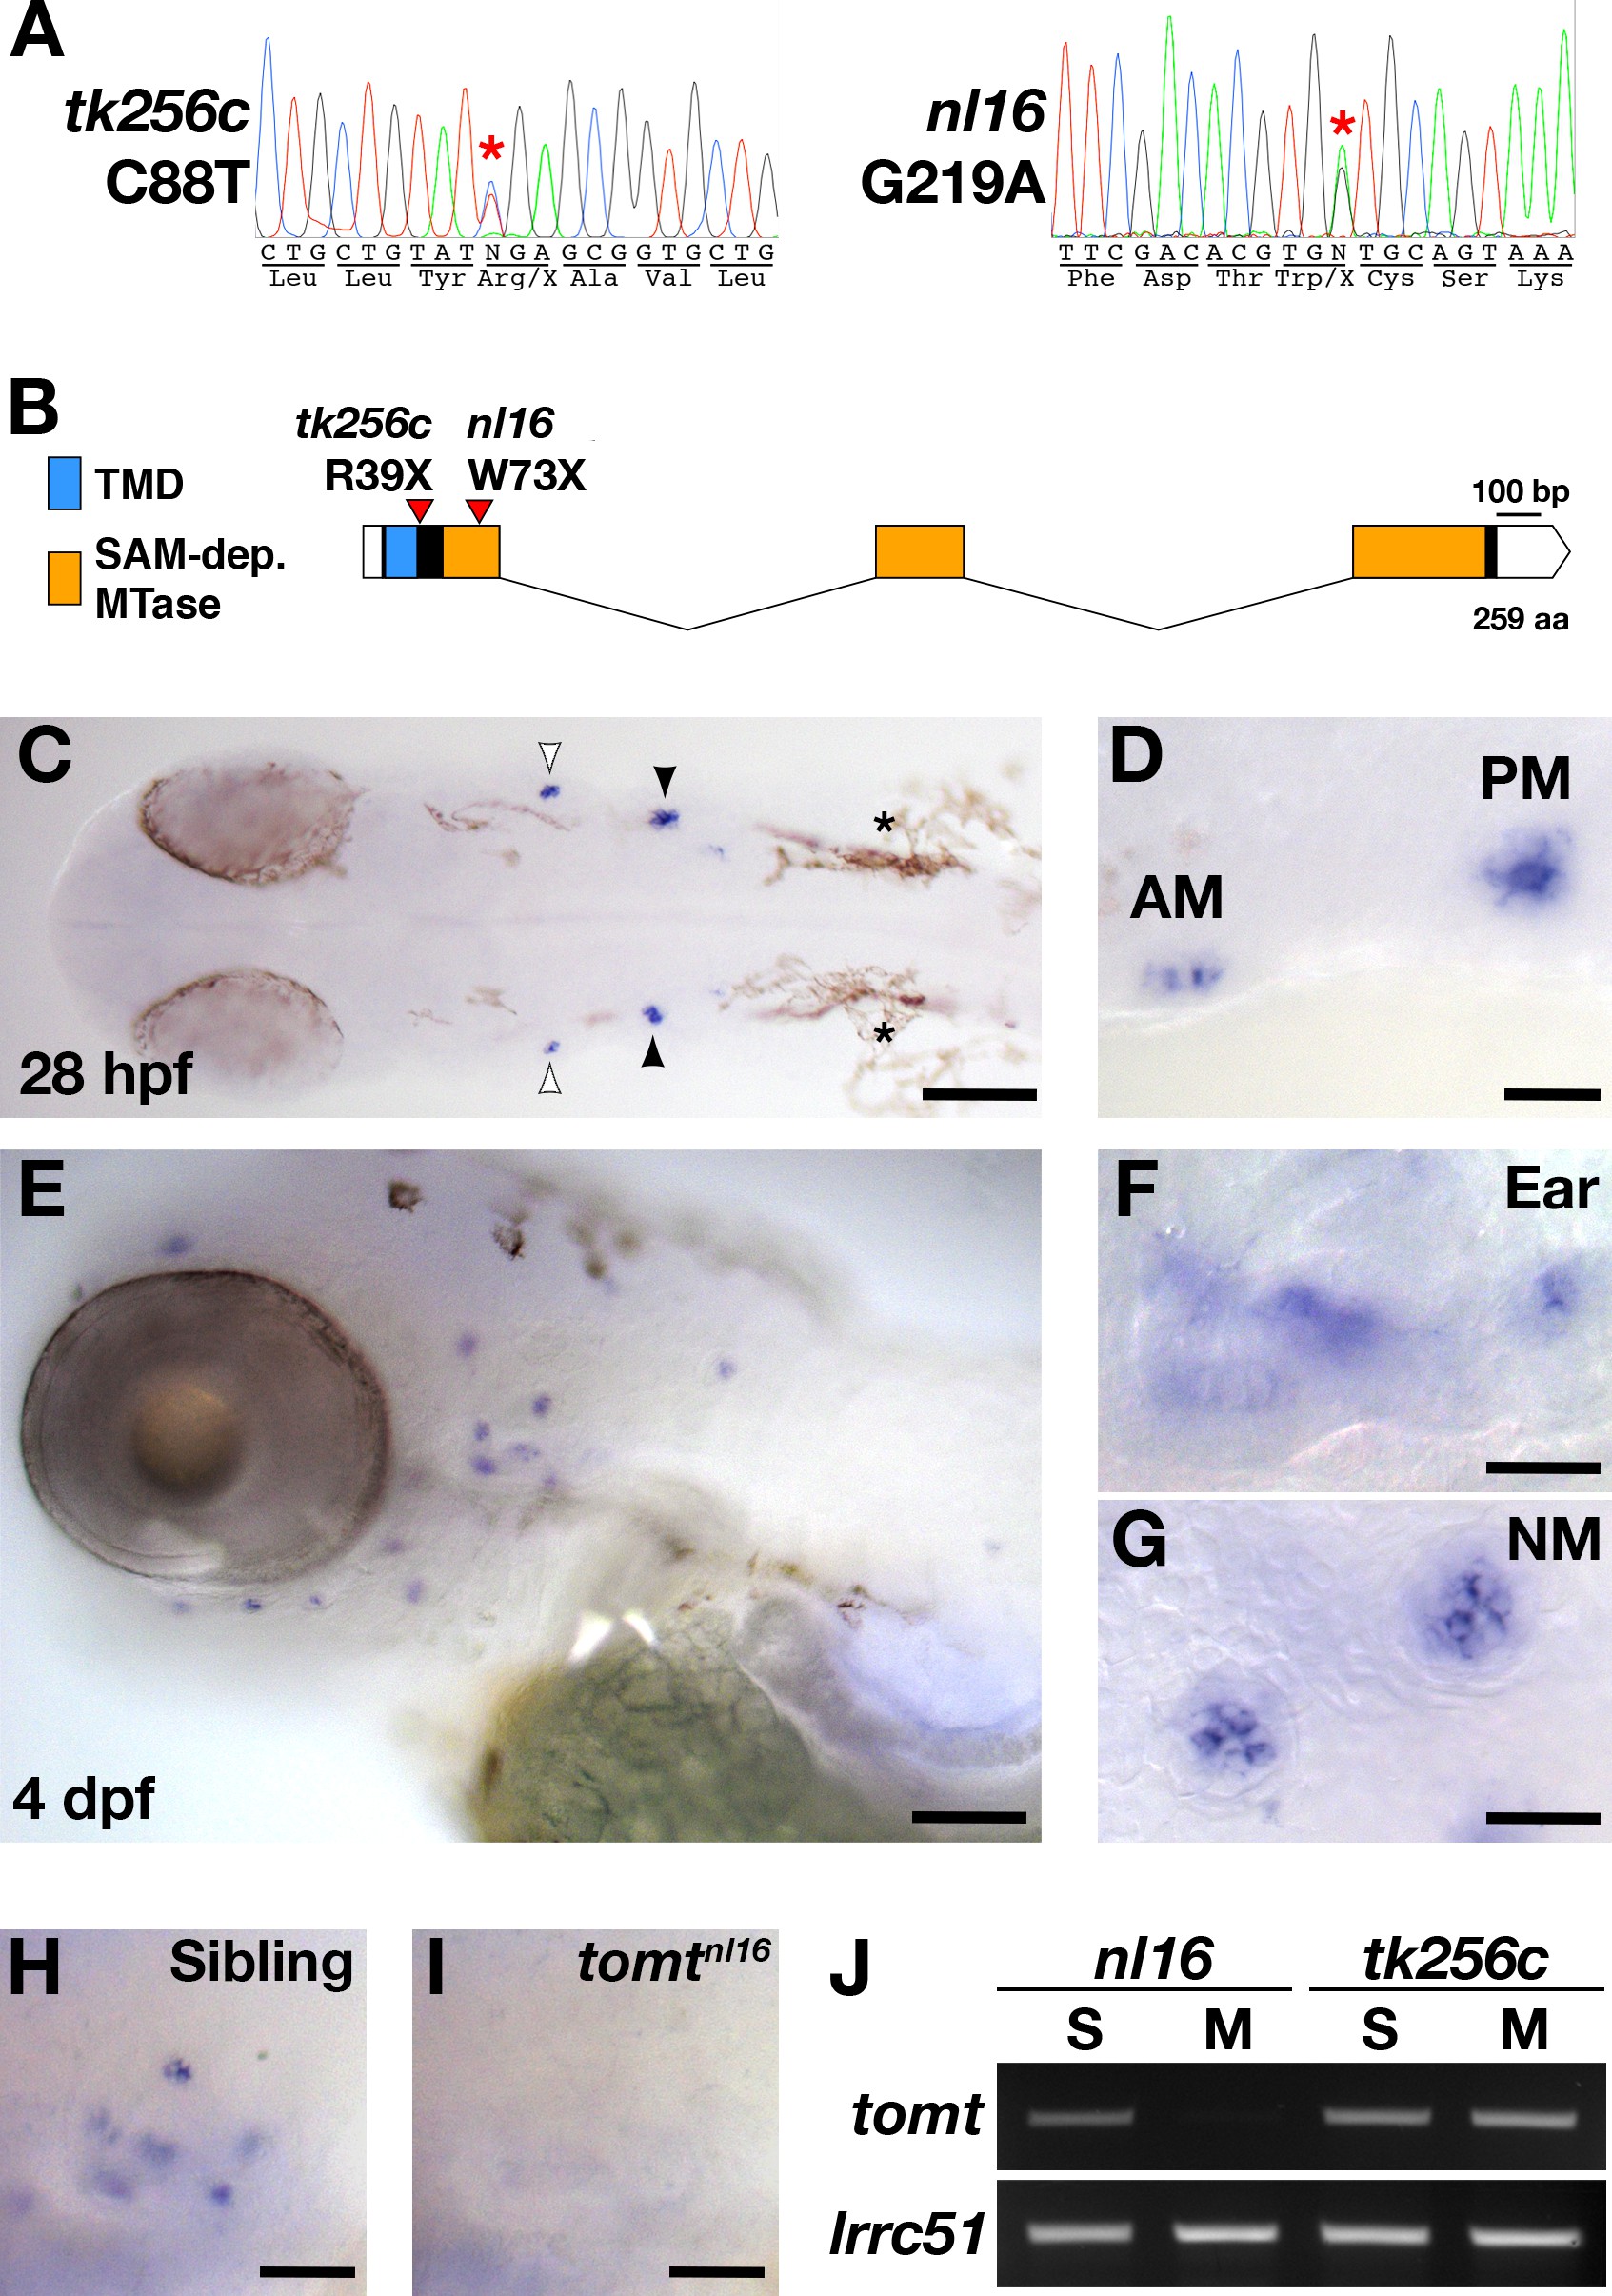
mercury mutations and tomt mRNA expression.
(A) Representative chromatograms from heterozygous mercury mutants showing the C88T and G219A mutations for the tk256c and nl16 alleles respectively. (B) Diagram of the predicted exon-intron structure for the tomt gene. Regions coding for the putative transmembrane domain (TMD, blue) and SAM-dependent O-methyltransferase domain (SAM-dep. MTase, orange) are shown, along with the positions of the tomttk256c R39X and tomtnl16 W73X mutations. (C–G) Whole mount mRNA in situ hybridization (ISH) for tomt in 28 hr post-fertilization (hpf) (C, D) and 4 days post-fertilization (dpf) (E-G) zebrafish larva. (C) At 28 hpf, tomt is expressed in exclusively in the presumptive anterior (AM) and posterior (PM) maculae of the developing ear, as indicated by the white and black arrow heads respectively. Pigment cells are indicated by asterisks (*). The embryo is shown in dorsal view with anterior to the left. (D) A close up of the AM and PM from the larva in C. (E–G) At 4 dpf, tomt is expressed exclusively in the hair cells of the inner ear (F) and lateral line neuromasts (G). Larva is shown in lateral view with anterior to the left and dorsal at the top. (H, I) ISH for tomt in a tomtnl16 WT sibling (H) and mutant (I) at 4 dpf. Inner ear sensory patches are shown. (J) RT-PCR for tomt and lrrc51 from total RNA isolated from 5 dpf tomtnl16 and tomttk256c siblings (S) and mutants (M). Scale bars: 100 µm in C and E, 25 µm in D, F and G, 50 µm in F and G.